


You know that feeling when a demo goes sideways?
Your rep spent an hour building slides about AWS integrations. The prospect uses Azure. Your carefully crafted Postgres migration story? They're on Snowflake. The "seamless Salesforce sync" you kept emphasizing? HubSpot shop.
The prospect's IT director stops the demo 15 minutes in. "I don't think this is the right fit for our environment."
This happens dozens of times every day across B2B sales teams.
Not because products are bad. Not because reps aren't skilled. Because they're walking into technical conversations blind, discovering architecture requirements after it's too late to adjust.
The gap between winning and losing often comes down to technology intelligence. Not better product features or slicker sales pitches - just knowing what companies actually use so you can speak their language.

Why Most Teams Are Flying Blind on Tech Stacks
Let's talk about how most teams currently handle technology research. And why it's broken.
Manual research spiral
Someone on your team (usually a tired SDR or AE) opens 15 browser tabs. Company website. Careers page. LinkedIn. Blog posts. Press releases. They're looking for clues about what technologies the prospect uses.
Half an hour later, they've found maybe 40% of the picture. The company's blog mentions Salesforce. A job posting from eight months ago lists Python and PostgreSQL. Someone's LinkedIn profile shows AWS experience.
But they're missing the marketing automation platform, the data warehouse, the business intelligence tools, the payment processor. All the technologies that will matter when integration questions come up.
Multiply this by 50 target accounts and you've burned a week of someone's time getting incomplete, possibly outdated information.
Confidence problem
Even when you find technology mentions, you don't know if they're current. That blog post about "evaluating Snowflake" from last year, did they buy it? That job posting mentioning Salesforce - are they actively using it or just hiring someone with that background?
Sales decisions need confidence, not guesswork. You can't customize a demo around technologies a company might be using.
Technology changes faster than you can track it
Companies migrate CRMs, upgrade their data warehouse, switch marketing automation, adopt new analytics tools. The competitive intelligence you gathered three months ago? A big chunk is probably wrong now.
Unless you're continuously monitoring technology changes, you're making decisions based on stale data.
How Data Enrichment Works
Data enrichment platforms take a completely different approach to technology intelligence. Instead of manually hunting for clues one company at a time, enrichment tools automatically detect and update tech stack information across thousands of companies simultaneously.
Here's what's actually happening behind the scenes.
Website Technology Detection
Enrichment providers scan websites to identify technologies through code analysis. They're looking at JavaScript libraries, analytics tracking codes, content management systems, ecommerce platforms, payment processors, and advertising pixels.
When you visit a website, you see the design and content. Enrichment tools see the underlying technology stack like React or Angular frameworks, Shopify or WordPress platforms, Stripe or PayPal payment processing.
This method works well for customer-facing technologies. If it's running on the public website, it can be detected. The limitation is it only shows you the frontend. You're missing databases, internal tools, and backend infrastructure.
Job Posting Analysis
This is where things get interesting. Companies reveal their internal technology stack through hiring.
When a company posts a job for a "Senior Data Engineer - Snowflake experience required," they're telling you they use Snowflake. When they need a "Python Developer familiar with Django and PostgreSQL," you know their backend stack.
Job posting analysis scans millions of listings daily to identify technologies mentioned in job titles, required skills, and technical requirements. It finds programming languages, databases, cloud platforms, development frameworks, CRM systems, and business intelligence tools.
The accuracy is high, companies don't hire for technologies they're not using. When multiple recent job postings mention the same tools, you have strong confirmation of active usage.
The limitation is it requires active hiring. Small companies or those not currently recruiting technical roles won't show up through job posting analysis.
Confidence Scoring Changes Everything
Here's what separates professional enrichment from guesswork: confidence levels.
High confidence means multiple recent signals confirm usage. Several job postings from the last 90 days, website detection showing active implementation, or verification through multiple independent sources. This is 80%+ accurate.
Medium confidence indicates some evidence but less certainty. One or two sources confirming usage, job postings from 3-12 months ago, or website detection without recent verification. Call this 70-80% accurate.
Low confidence suggests possible usage based on limited signals, older mentions, indirect evidence, or single-source detection. This is 50-70% accurate and shouldn't drive important decisions.
Smart teams use confidence scoring to make better decisions. High-confidence data drives demo customization and sales strategy. Medium-confidence data works for broader targeting and market analysis. Low-confidence data helps with research but doesn't dictate account-specific approaches.
The Three Major Technology Data Sources
Understanding what each data source reveals helps you get complete intelligence rather than partial pictures. We also cover the basics in our guide on where to check what tech stack a company uses.
BuiltWith: Website and Frontend Intelligence
BuiltWith specializes in analyzing what technologies power websites. They continuously scan websites and detect code signatures across thousands of different technologies and track over 370 million active domains.
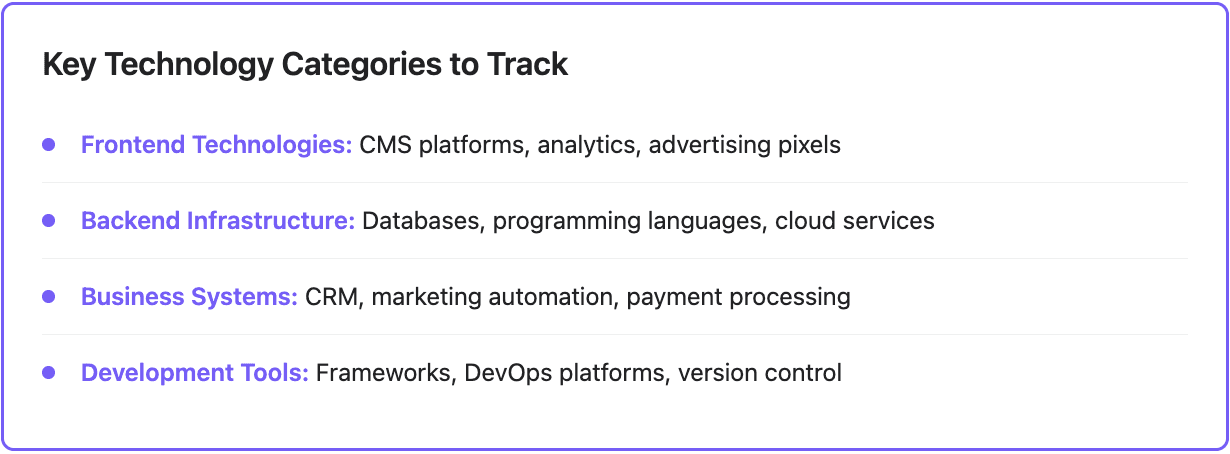
What BuiltWith finds: Content management systems (WordPress, Webflow, Squarespace), ecommerce platforms (Shopify, WooCommerce, Magento, BigCommerce), analytics and tracking (Google Analytics, Segment, Mixpanel), advertising technologies (Facebook Pixel, Google Ads, LinkedIn Insight Tag), payment processing (Stripe, PayPal, Square), and hosting providers.
Where it's strongest: Identifying ecommerce platforms for merchant-focused sales teams, finding companies using specific marketing or advertising tools, understanding customer-facing technology choices, and competitive monitoring of website technology changes.
What you'll miss: Backend infrastructure, databases, internal business tools, development frameworks not visible on the frontend, and technologies running behind authentication.
TheirStack: Internal Technology Through Job Postings
TheirStack takes a fundamentally different approach by sourcing technology data from job postings across 34+ million listings globally. When companies hire for specific technologies, it signals active usage and ongoing investment.
What TheirStack finds: Programming languages (Python, Java, JavaScript, Go, Ruby), databases (PostgreSQL, MongoDB, MySQL, Snowflake, Databricks), cloud platforms (AWS, Azure, Google Cloud), DevOps and infrastructure (Kubernetes, Docker, Jenkins), CRM and business systems (Salesforce, HubSpot, NetSuite, SAP), and data science tools (TensorFlow, PyTorch, Spark).
Where it's strongest: Discovering backend technology not visible on websites, understanding database and infrastructure choices, finding companies actively investing in specific technologies, and identifying buying signals through technology hiring patterns.
The confidence factor: When a company posts 5 jobs in the last 60 days all mentioning Snowflake, you have very high confidence they're using it actively. When there's one mention from 18 months ago, confidence drops.
What you'll miss: Technologies at companies not currently hiring, consumer-facing tools that don't require technical expertise, and technologies used by small teams without dedicated job postings.
Wappalyzer: Broad Technology Coverage
Wappalyzer combines browser-based detection, web crawling, and community-sourced technology fingerprints to identify over 7,400 technologies across 106 categories.
What Wappalyzer finds: Web frameworks (React, Vue.js, Angular), analytics platforms, marketing automation, ecommerce infrastructure, content delivery networks, and JavaScript libraries.
Where it's strongest: Daily updates for actively monitored websites, clean API access for enrichment workflows, technology trend tracking and market share analysis, and real-time detection as websites change.
Their data updates daily for active websites, which means you're getting current information rather than stale snapshots.
Practical Workflows That Are Worth It
Let's look at how different teams use tech stack enrichment to solve real problems. No theoretical examples, these are the workflows that produce measurable results.
Sales: Pre-Demo Intelligence Gathering
The situation: Your AE has a demo scheduled with a mid-market SaaS company. They need to know the tech stack to customize the presentation and anticipate integration questions.
The workflow without enrichment: AE spends 45 minutes browsing the company website, checking job postings, and guessing at their infrastructure. They make assumptions. They get it wrong half the time.
The enrichment workflow: Add the company domain to your enrichment tool, select relevant technology categories (CRM, data warehouse, marketing automation, analytics), filter results by high confidence scores, review detection dates to confirm current usage, and identify integration opportunities before the call.
What this looks like in practice: The AE discovers the prospect uses Salesforce, Snowflake, and Marketo. They rebuild the demo to highlight native integrations with all three. They proactively address Snowflake data sync concerns. They reference similar customers using the same stack. The demo feels custom-built rather than generic.
The difference in outcomes: Demos customized using enrichment data convert 30-40% better than generic presentations because every integration story is relevant, technical objections get addressed proactively, and the product feels like it was built for their environment.
Marketing: Technology-Based Segmentation
The situation: Your demand gen team wants to target companies using technologies that commonly migrate to your platform.
The workflow without enrichment: Marketing builds campaigns based on industry and company size. They're targeting everyone in the space rather than accounts showing actual fit signals. Cost per lead stays high because most targets aren't good fits.
The enrichment workflow: Build a list of target account domains from your ICP criteria, enrich for specific technology categories that indicate fit, filter for legacy systems that commonly migrate, add confidence thresholds to eliminate false positives, check company size and industry for additional qualification, and export segments for campaign targeting.
What this looks like in practice: Marketing creates a segment of 2,847 companies confirmed to use legacy marketing automation platforms (Eloqua, Marketo Classic, Pardot without Einstein). They exclude companies that recently upgraded to modern versions. Campaign messaging references specific pain points of legacy systems. Ad creative speaks directly to common migration triggers.
The results: Technology-targeted campaigns generate qualified leads at 40-50% lower cost than demographic targeting alone. Response rates improve because messaging resonates with actual pain points rather than assumed challenges.
Product: Integration Prioritization Decisions
The situation: Your product roadmap includes potential integrations with 15 different platforms. You need to prioritize based on actual customer and prospect usage, not assumptions about market share.
The workflow without enrichment: Product team makes decisions based on general market research, sales team opinions, and a few vocal customers. They build integrations that seem popular but don't match what your actual market uses.
The enrichment workflow: Export your customer database and top 500 target prospects, enrich both lists for relevant technology categories, analyze distribution to see which platforms appear most frequently, calculate overlap between current customer usage and prospect usage, identify platforms showing growth in job postings, and prioritize integrations based on actual data.
What this looks like in practice: Analysis shows 68% of customers and high-fit prospects use four specific platforms: HubSpot, Salesforce, Snowflake, and Tableau. These four get prioritized for deep integration development. Resources aren't wasted on platforms used by only 5-10% of the market.
The impact: Integration adoption rates increase 3-4x when you build for technologies your customers actually use. Partnership conversations become more productive because you're pursuing ecosystem players that matter to your market.
Customer Success: Expansion Signal Detection
The situation: CS wants to identify expansion opportunities among existing customers but doesn't have visibility into technology changes that might signal growth or new use cases.
The workflow without enrichment: CS waits for customers to mention new initiatives or responds to support tickets that reveal technology changes. Most expansion opportunities get discovered late or missed entirely.
The enrichment workflow: Set up continuous enrichment monitoring for your customer database, track technology additions in categories adjacent to your product, monitor job posting increases indicating team growth, identify customers adopting technologies your platform integrates with, and flag accounts showing technology modernization patterns.
What this looks like in practice: CS gets alerts when customers adopt Snowflake, AWS, or advanced analytics tools, all indicators of data maturity and potential need for expanded platform usage. When a customer starts hiring data engineers and mentions Databricks in job postings, CS knows they're scaling data operations and might need higher service tiers.
The results: Proactive expansion conversations based on technology signals convert at significantly higher rates than generic "let's discuss your usage" check-ins. You're approaching customers exactly when they have new needs, not randomly hoping for growth.

Getting Started With Tech Stack Enrichment
Most teams overthink the getting-started process. They want to enrich everything perfectly before taking action. That's backwards.
Start with high-value use cases where technology intelligence immediately impacts revenue.
1: Enrich Your Active Pipeline
Don't start by enriching your entire database of 50,000 companies. Start with the 30-50 opportunities currently in your pipeline.
These accounts have immediate value. Sales is actively working them. Knowing their tech stack this week directly affects near-term deals.
Pick 3-5 technology categories that matter most for your product positioning. For most B2B companies, that's CRM systems, marketing automation, data platforms, analytics tools, and payment processing.
Run enrichment on your active opportunities. Review the results. Understand what information you're getting, what confidence levels look like, and what gaps exist.
Have your sales team actually use this intelligence in their next calls. Ask them what was helpful, what was missing, and what would make the data more actionable.
2: Expand to Target Accounts
Once enrichment proves valuable for active deals, expand to your broader target account list. This might be a few hundred to a few thousand companies depending on your market.
This creates the foundation for segmentation and targeting. You can now build lists like "companies using Salesforce with 100-500 employees in financial services" or "accounts using legacy marketing automation that commonly migrate."
Test these segments with targeted campaigns. Measure whether technology-based targeting improves conversion rates compared to demographic segments.
The goal is proving whether technology intelligence improves your results enough to justify ongoing investment.
3: Automate and Integrate
Once you've proven value, build sustainable workflows that don't require manual effort.
Connect enrichment to your CRM so new leads get automatically enriched as they enter your system. Set up scheduled re-enrichment for target accounts and active opportunities so data stays current. Create alerts for technology changes that signal buying opportunity or expansion potential.
The enrichment should fade into the background of your GTM operations, automatically providing intelligence without anyone thinking about it.
4: Advanced Use Cases
After enrichment becomes routine for sales and marketing, expand to more sophisticated applications.
Technology-based lead scoring that weighs accounts using compatible technologies higher in your queue. Competitive displacement campaigns targeting companies using specific competitor tools. Partnership intelligence identifying which ecosystem players matter most to your market. Customer success monitoring for expansion signals based on technology changes.
Each use case builds on the foundation but adds specialized value for different teams.
Common Mistakes That Waste Enrichment Investment
Even teams using enrichment platforms make predictable mistakes that limit ROI.
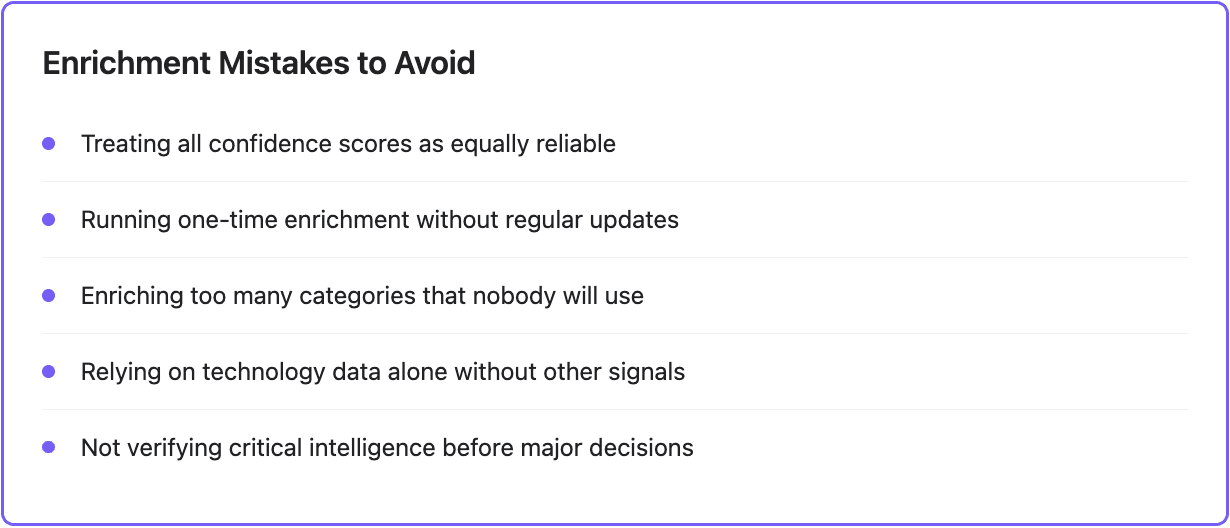
Mistake 1: Ignoring Confidence Scores
Some teams treat all enrichment results as equally reliable. They build sales strategies around low-confidence technology detections that might be completely wrong.
When you see "Low Confidence: 45%" next to a technology, that's telling you there's better than coin-flip odds this is wrong. Don't customize demos or build campaigns around low-confidence data.
Use confidence levels appropriately. High confidence (85%+) can drive demo customization and account-specific strategy. Medium confidence (70-85%) works for broader targeting and market analysis. Low confidence (below 70%) is fine for research but shouldn't dictate important decisions.
Mistake 2: One-Time Enrichment
Teams enrich their database once, then never update it. Six months later they're making decisions based on stale data and wondering why their technology-based segments stopped performing.
Companies change their tech stacks constantly. The CRM they were using last quarter might have been replaced. The marketing automation platform they evaluated might be fully implemented now. The data warehouse mentioned in old job postings might have been replaced by something newer.
Set up automated re-enrichment on a schedule that matches your sales cycle. Weekly for high-velocity sales. Monthly for most B2B teams. Quarterly for strategic accounts. Prioritize updates for active opportunities and high-value targets over your entire database.
Mistake 3: Enriching Too Many Categories
New users often try to enrich for every available technology category. They want to know every single tool a company uses across 20+ different categories.
This creates overwhelming amounts of data that nobody uses. You're spending enrichment credits on information that will never influence a decision.
Start with 3-5 categories directly tied to your use cases. Sales teams typically need CRM, marketing automation, and analytics. Product teams focus on categories related to integration opportunities. Customer success might prioritize business intelligence and customer support platforms.
You can always add categories later as you prove value. Start focused rather than comprehensive.
Mistake 4: Not Combining Technology with Other Signals
Technology data alone doesn't tell you if a company is a good prospect right now. Knowing they use your competitor's technology is interesting, but are they happy with it? Are they evaluating alternatives? Do they have budget for a change?
The most powerful intelligence combines tech stack with additional context. Company using competitive CRM + recently raised funding + hiring RevOps roles = strong buying signal worth immediate outreach. Company using legacy marketing automation + executive changes + competitor job postings mentioning modern tools = migration opportunity.
Platforms like Databar let you enrich for technology alongside company firmographics, funding events, job posting analysis, leadership changes, and social signals. Multi-signal enrichment reveals opportunities single data types miss.
Mistake 5: Not Verifying Critical Intelligence
Enrichment platforms achieve 85-95% accuracy for high-confidence matches. That means 5-15% might still be wrong.
For most use cases, that error rate is fine. But before committing significant resources based solely on enrichment data, quick verification makes sense.
Before building an entire demo around assumed tech stack, confirm during discovery. Before allocating engineering resources to an integration based purely on enrichment, validate with a few customers. Before pursuing a major partnership, verify the partner's market penetration with your actual prospects.
Use enrichment to guide strategy and targeting. Verify through conversation for high-stakes decisions.
How Databar Simplifies Multi-Source Enrichment
The challenge of getting the best data is that you usually need subscriptions to multiple providers. BuiltWith costs $295-995 monthly. TheirStack starts around $299. Wappalyzer begins at $250. Managing three separate platforms means three logins, three APIs, three billing relationships.
Databar provides access to 90+ data providers 8including BuiltWith, TheirStack, Wappalyzer, and dozens of others) through a single platform.
When you enrich for tech stack through Databar, the system automatically queries multiple sources. It checks BuiltWith for website technologies, TheirStack for backend infrastructure, and Wappalyzer for real-time detection. If the first provider doesn't have data, it automatically tries the next source.
You get waterfall enrichment without managing multiple platforms. One workflow. One subscription. Complete coverage.
The platform also lets you combine tech stack enrichment with other data types (company firmographics, contact information, funding events, job posting analysis, and intent signals) all in the same workflow.
Instead of enriching for technology separately from finding contacts separately from checking funding separately, you build one workflow that gathers everything simultaneously.
For teams scaling enrichment operations, this eliminates the complexity of managing multiple data vendors while improving data coverage through automatic waterfall querying.
Measuring Whether This Works
Enrichment platforms cost money. You need to prove the investment delivers measurable business impact beyond just "having better data."
Sales Efficiency Metrics
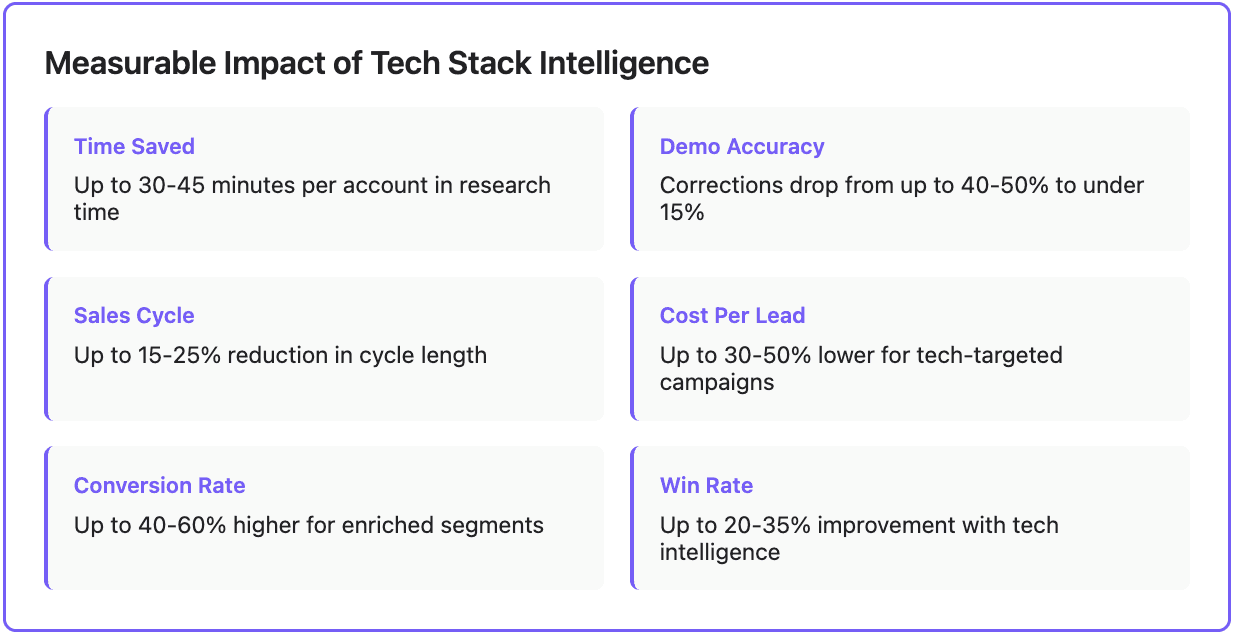
Time saved on account research is the most immediate impact. Track how long reps spend researching accounts before enrichment versus after. Most teams save 30-45 minutes per account, adding up to 10-15 hours per rep monthly.
Demo customization accuracy matters more than time saved. Track how often prospects correct assumptions about their tech stack during demos. Before enrichment, you might get corrected 40-50% of the time. With high-quality enrichment, that drops to under 15%.
Sales cycle length often improves when reps know the tech stack upfront. Compare cycle times for deals where technology was discovered early versus deals where integration requirements became late-stage surprises. Technology intelligence typically reduces sales cycles 15-25% by addressing concerns proactively.
Marketing Performance Metrics
Cost per qualified lead is the clearest indicator of targeting effectiveness. Calculate CPL for campaigns using technology-based targeting versus demographic segments.
Most teams see 30-50% lower CPL when targeting based on actual technology usage because fewer false positives enter the funnel. You're not wasting impressions on companies that aren't good fits.
Conversion rates through the funnel show whether technology qualification actually predicts success. Track how technology-qualified leads progress compared to non-qualified leads. Well-enriched segments typically show 40-60% higher conversion rates.
Revenue Impact Metrics
Win rate improvement is the ultimate test. Compare win rates on opportunities where sales had technology intelligence versus opportunities without enrichment.
Most teams see 20-35% win rate improvement because demos feel custom-built for prospects' environments, integration objections get addressed early before they become dealbreakers, and positioning resonates with actual technology choices.
Deal size can also improve when early technology knowledge enables better scoping and multi-product positioning.
For customer success, measure whether technology change monitoring leads to more expansion revenue and higher net revenue retention.
Technology intelligence often makes the difference
Your competitor isn't outselling you because they have better product features or smoother sales pitches. They're winning because they know which CRM prospects use, which data warehouse they're running, which marketing automation platform they've invested in—all before the first conversation.
They walk into demos speaking the prospect's language. They address integration concerns proactively. They position themselves as the obvious choice because everything they show actually fits the environment.
That intelligence isn't magic. It's systematic data enrichment built into their GTM operations.
The teams winning are enriching their databases, targeting based on actual technology usage, and customizing touchpoints with relevant context.
You can start today. Take your active pipeline—the 30-50 deals currently being worked—and enrich them for the technology categories that matter most to your product. See what intelligence you get. Have your sales team use it in their next calls.
Then expand from there.
Because in modern B2B sales, knowing the tech stack isn't a nice-to-have. Oftentimes, it's the difference between winning and watching competitors close deals you should have won.
Frequently Asked Questions
What is tech stack enrichment?
Tech stack enrichment is the automated process of identifying which technologies companies use and adding that information to your CRM or prospect database. Enrichment platforms detect CRM systems, marketing automation, databases, analytics tools, programming languages, and other technologies, then append this data to your company records so sales and marketing teams have intelligence about technology environments without manual research.
Which companies should I enrich for tech stack data?
Start with your active sales pipeline, opportunities currently being worked where technology intelligence will immediately impact near-term deals. Then expand to your target account database and high-value prospects. Don't start by enriching your entire database of 50,000 companies. Begin with the few hundred accounts that matter most, prove value, then scale enrichment to broader lists.
How often should tech stack data be updated?
Technology data decay depends on your market and sales cycle. High-velocity sales teams should re-enrich active opportunities monthly. Most B2B teams benefit from quarterly re-enrichment of target accounts and active pipeline. Companies change technology constantly (CRM migrations, marketing automation upgrades, data warehouse transitions) so static enrichment becomes stale.
Can I enrich my CRM automatically with tech stack data?
Yes, most enrichment platforms offer CRM integrations that automatically enrich new leads as they enter your system and periodically update existing records. Platforms like Databar connect directly to Salesforce, HubSpot, and other CRMs, running enrichment workflows automatically rather than requiring manual exports and imports. This keeps your CRM current with technology intelligence without ongoing manual work.
What technology categories should I prioritize for enrichment?
Focus on categories that directly impact your product positioning and integration story. Most B2B teams prioritize CRM systems, marketing automation, analytics platforms, and data warehouses. Product teams add databases, cloud infrastructure, and development tools. Customer success teams monitor business intelligence and customer support platforms. Start with a few categories tied to your use cases rather than enriching every available category.
Also Interesting
Best B2B Data Enrichment Tools in 2026
Clay Review 2026: Features, Pricing, Pros, Cons and Alternatives
Reverse Email Lookup: Turn an Email Into a Complete Lead Profile
Recent articles
See all


