

“The momentum was incredible. Sales volume was up, the team was hitting their stride, but something felt wrong.
Every account executive was doing their own thing. Building their own prospect lists. Using their own methods. There were no systems to measure what actually made someone successful versus just busy.
That's when I realized: momentum without systems is just organized chaos waiting to collapse.”
Most operators get stuck in one of two places. Either they're drowning in spreadsheets and manual processes that don't scale, or they're building sophisticated dashboards that nobody actually uses.
The companies that break through? They build foundations first. They establish measurement systems that turn individual effort into predictable outcomes. They create frameworks that work whether you're managing 5 reps or 50.

When Growth Momentum Hits Reality
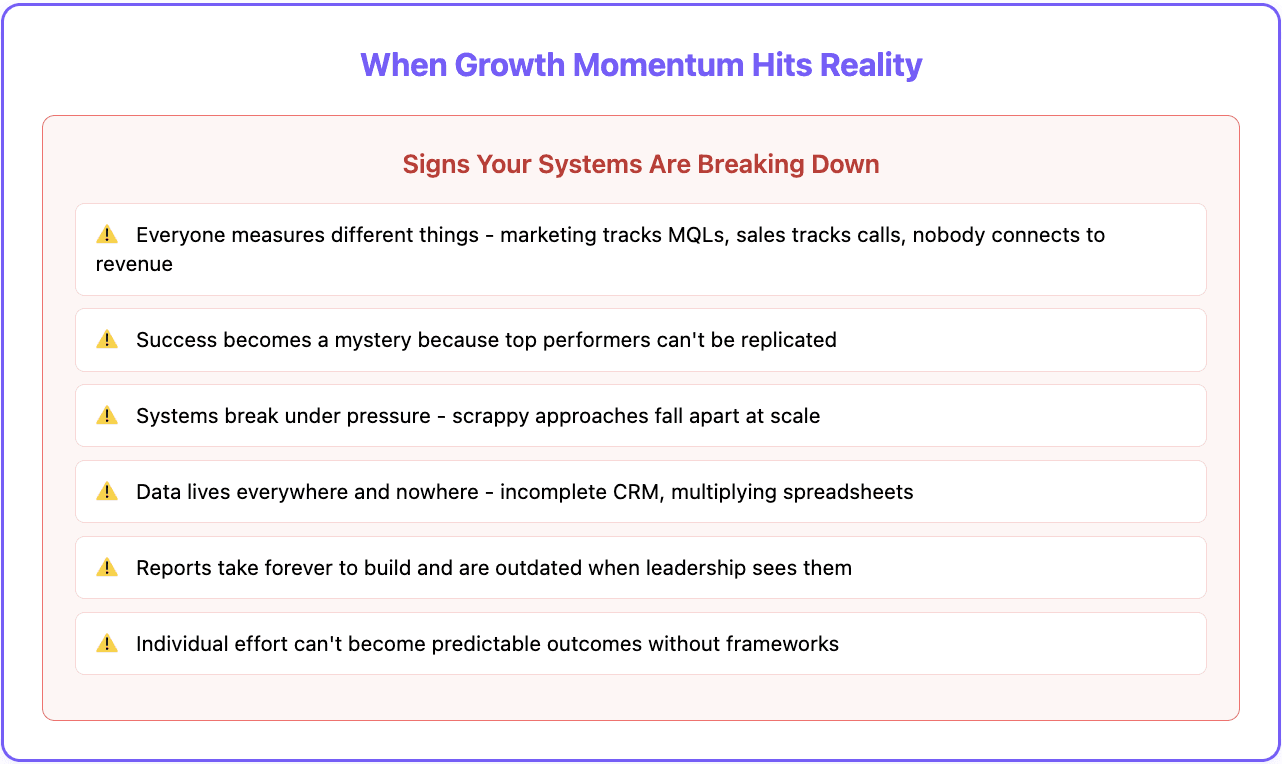
Here's what happens when companies hit that inflection point—around 10-20 people, when everyone can't just "figure it out" anymore:
Everyone measures different things. Marketing tracks MQLs. Sales tracks calls. Nobody connects activity to actual revenue outcomes. Success becomes a mystery because your top performer closes deals, but you can't replicate what they're doing since nobody's measuring the right activities.
Systems break under pressure. The scrappy approaches that got you here start falling apart when you need predictability. Data lives everywhere and nowhere—CRM data is incomplete, spreadsheets multiply, and reports take forever to build and are outdated by the time leadership sees them.
The solution isn't more tools or bigger dashboards. It's building operational foundations that create accountability and predictability.
Learn the Tools First (Before Building the System)
Most operators make a crucial mistake: they try to build the perfect system before understanding what they're working with.
Smart operators do the opposite. They learn through doing, not asking.
Start by pushing your existing tools to their breaking points. See where the limitations are. Find out what breaks first. This gives you real insight into what needs fixing versus what just needs better process.
When you understand the constraints, you can build systems that actually solve problems instead of creating new ones. Test everything yourself before rolling it out to the team. Break things intentionally to find the weak spots. Build working prototypes before getting input from others, and focus on what's limiting growth rather than what looks broken.
This approach lets you collaborate more effectively later because you're bringing solutions, not just problems.
The Three Pillars That Actually Work
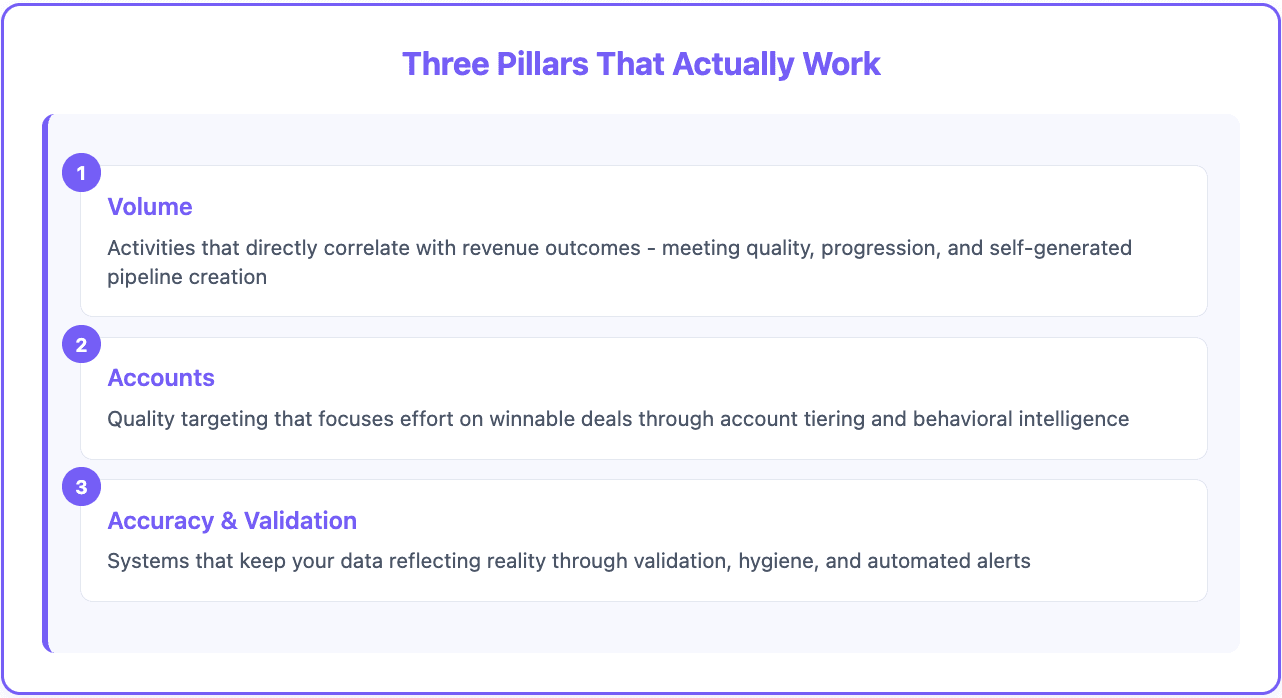
After looking at implementations of revenue operations across dozens of companies, three pillars consistently separate predictable growth from organized chaos:
Pillar 1: Volume - Activities that directly correlate with revenue outcomes
Pillar 2: Accounts - Quality targeting that focuses effort on winnable deals
Pillar 3: Accuracy & Validation - Systems that keep your data reflecting reality
These aren't theoretical concepts but rather operational systems you can implement with your existing tools, starting today.
Volume: Measuring What Moves the Revenue Needle
Volume isn't about activity counting. It's about measuring the quality and depth of revenue-generating activities.
The Two Components That Matter
Meeting Quality and Progression: Every deal needs to progress through specific types of interactions, each with clear qualification criteria.
The meetings that actually matter include discovery meetings that uncover real pain points and budget reality, technical assessments with stakeholders who influence decisions, economic buyer meetings where pricing and terms get discussed, and multi-stakeholder engagement across different departments.
Track how deals progress through these meeting types. A "qualified opportunity" without technical assessment and economic buyer engagement isn't qualified—it's pipeline inflation.
Self-Generated Pipeline Creation: Top performers don't just work leads from marketing. They build their own book of business through strategic prospecting.
Measure what percentage of each rep's pipeline comes from their own prospecting versus marketing-generated leads. Set targets like "30% of quarterly pipeline must be self-generated."
Implementation Framework
Quality gates define exactly what qualifies a deal at each stage. For discovery, you need pain identified, budget discussed, and timeline established. Technical stages require technical stakeholder engagement and documented requirements. Economic stages need economic buyer participation and pricing discussions.
Multi-threading metrics track stakeholder engagement per opportunity. Deals with 3+ engaged stakeholders close 40% more often. Pipeline source attribution dashboards show self-generated versus marketing-sourced pipeline by rep and by quarter.
Accounts: Quality Over Quantity Every Single Time
Most revenue operations fail because teams pursue deals they'll never win. Account quality beats volume every time.
The Tiering System That Works
Tier 1 Accounts represent your top 20% of potential value. These require custom account planning and stakeholder mapping, multi-threading across departments and geographies, executive-level engagement with custom demo environments, plus dedicated resources and longer sales cycles.
Tier 2 Accounts make up the middle 60% of your pipeline. They follow standardized sales processes with qualification criteria, standard demo and content delivery, manager-level engagement, and territory assignment.
Tier 3 Accounts are volume plays that use self-service trials and automated nurture sequences, inside sales support with standardized pricing, plus quick qualification and fast decision cycles.
Account Quality Indicators
Firmographic signals include company size matching your sweet spot, industry alignment with your strongest use cases, technology stack compatibility, and geographic plus regulatory fit. Behavioral intelligence covers product trial engagement and feature usage, content consumption patterns and sales engagement, plus website exploration depth and repeat visits.
Intent and timing signals reveal recent hiring in relevant departments, funding announcements or acquisition activity, technology vendor changes or evaluations, and competitive landscape shifts.
Start by analyzing your closed-won deals from the past year. What patterns emerge? Build your Tier 1 criteria around those characteristics, then create different processes for each tier.

Accuracy & Validation: Your Operational Backstop
This pillar prevents garbage data from corrupting your entire system. It's the quality assurance layer that keeps everything honest.
Real-Time Validation Systems
Meeting classification and tracking ensures every customer interaction gets properly categorized. You need to know who attended and what roles they played, meeting type and objectives achieved, outcomes generated and next steps committed, plus decision maker engagement and buying signals.
Opportunity hygiene audits through regular pipeline reviews ensure accuracy. Contact roles must be current with verified decision-maker status, deal amounts should match latest proposals and discussions, close dates need to be realistic based on historical cycle data, and competitive landscape plus stakeholder mapping should be complete.
Automated alert systems flag deals that don't follow normal patterns including unusually fast progression that suggests possible data errors, extended stagnation requiring intervention, missing stakeholders indicating incomplete qualification, and pricing anomalies needing validation.
The Validation Framework
Weekly data maintenance requires reps to spend 30 minutes weekly updating deal details. This isn't busywork—it's the foundation of predictable revenue. Manager pipeline reviews happen monthly, checking stakeholder mapping completeness and accuracy, meeting progression patterns and timing, competitive intelligence and differentiation, plus technical requirement validation and next steps.
Executive visibility comes through leadership dashboards showing pipeline health metrics like coverage by probability-weighted value and close date, velocity trends by source, tier, and rep, win rates by competitor, use case, and deal size, plus forecast accuracy trends over time.
Building Your Revenue Data Skeleton
The key insight: measure what connects, not everything that moves.
Your data skeleton needs three levels that connect to each other.
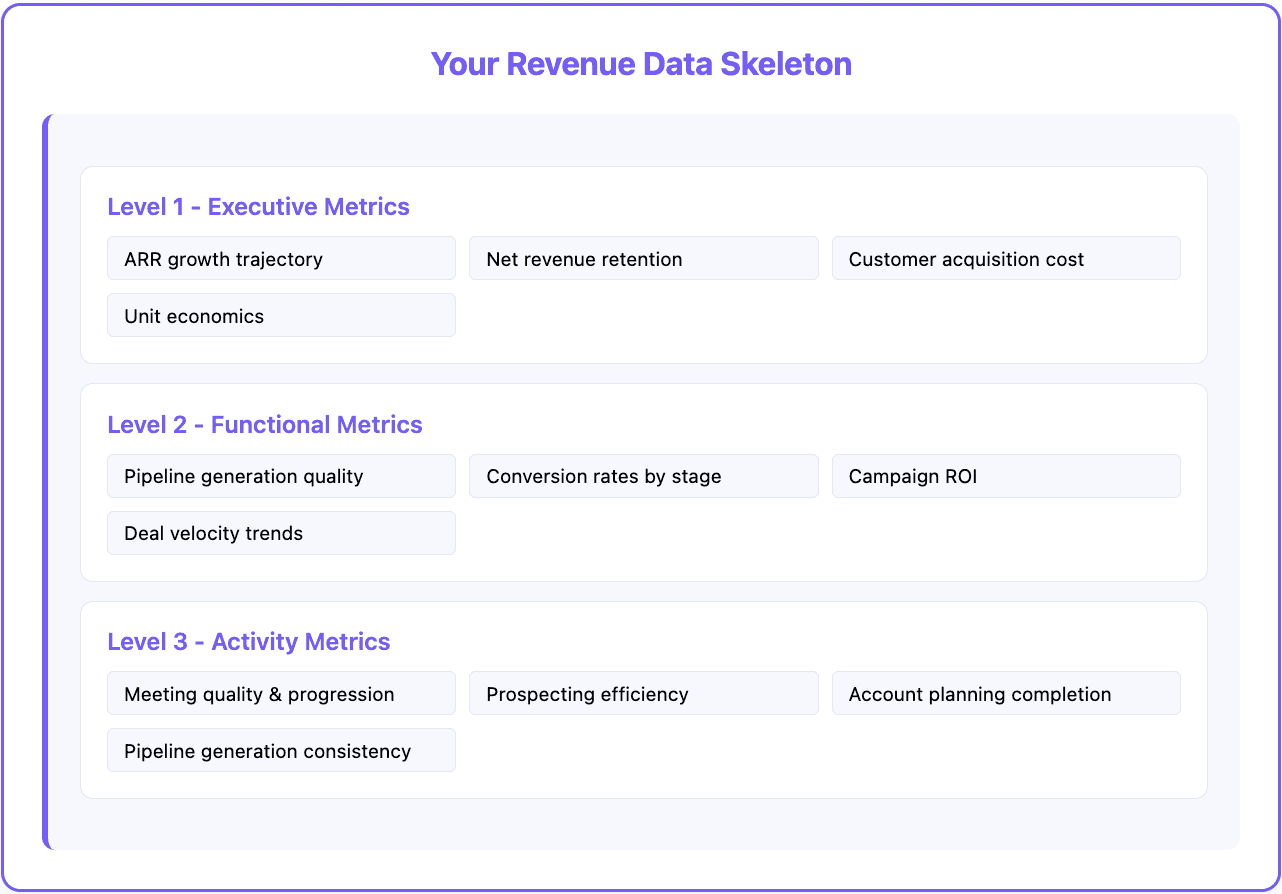
Level 1 - executive metrics include annual recurring revenue growth and trajectory, net revenue retention and expansion rates, customer acquisition cost and lifetime value ratios, plus unit economics and margin performance.
Level 2 - functional metrics break down by team. Marketing tracks pipeline generation quality, campaign ROI, and lead scoring accuracy. Sales monitors conversion rates by stage, deal velocity, and quota attainment trends. Customer Success watches expansion pipeline, churn prediction, and adoption metrics.
Level 3 - activity metrics focus on individuals, measuring meeting quality and progression effectiveness, prospecting efficiency and source attribution, account planning completion and stakeholder mapping, plus pipeline generation consistency by source.
The magic happens when these levels predict each other. Drops in Level 3 activity quality should forecast Level 2 functional changes before they impact Level 1 outcomes.
Why Spreadsheets Beat Fancy Dashboards (Sometimes)
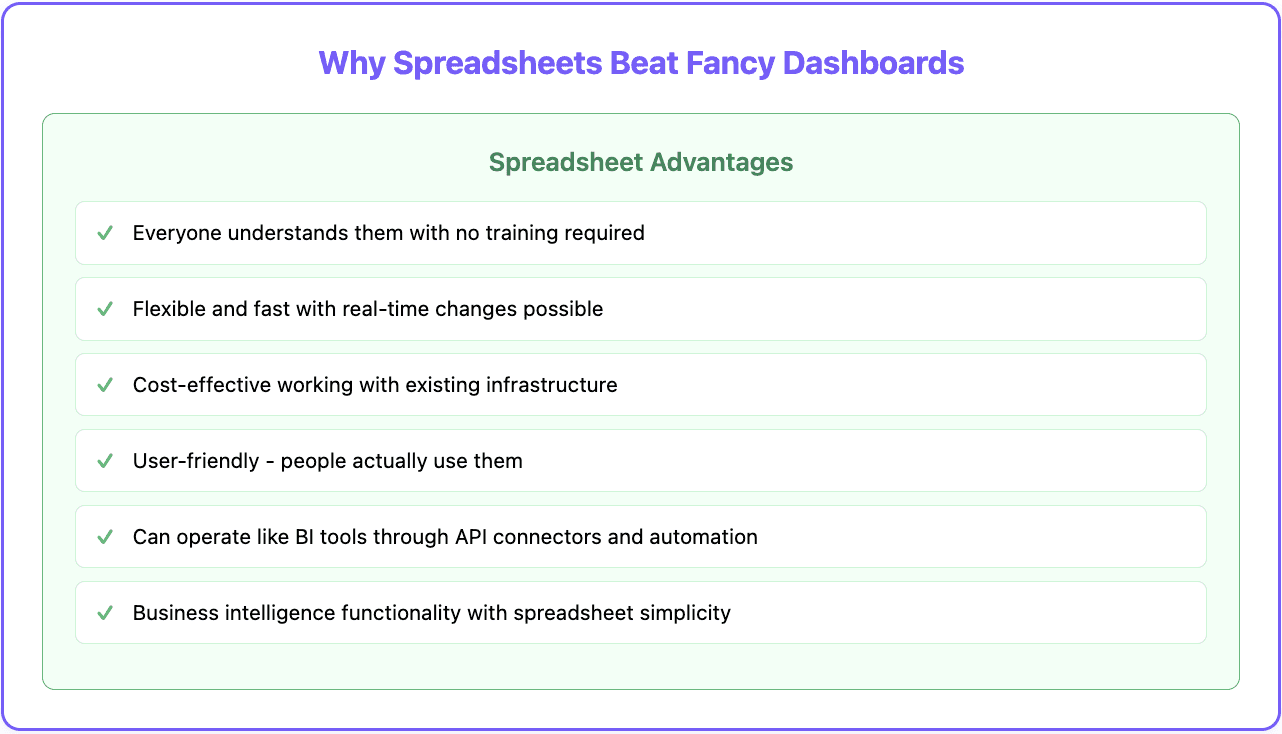
Here's an unpopular truth: most revenue operations can be built more effectively in spreadsheets than expensive BI tools.
Spreadsheets work because everyone understands them with no training required. They're flexible and fast, allowing real-time changes. They're cost-effective, working with existing infrastructure, and they're user-friendly—people actually use them.
The secret is making your spreadsheets operate like business intelligence tools through automated data connections using API connectors or tools like Zapier to populate data from your CRM, marketing automation, and other systems. Build comprehensive metric structures with tiles showing numbers and percentages rather than visual charts, organizing 50-60 metrics in one system by level.
Set up regular update cycles that automate refreshes so data stays current without manual intervention, and create cross-functional views where the same data is accessible to all teams, formatted for their specific needs.
Your goal: business intelligence functionality with spreadsheet simplicity.
> Get started with Databar.ai today >
From Manual to Automated: The Smart Operator's Approach
The best operators don't start with automation. They build systems first, then automate what works.
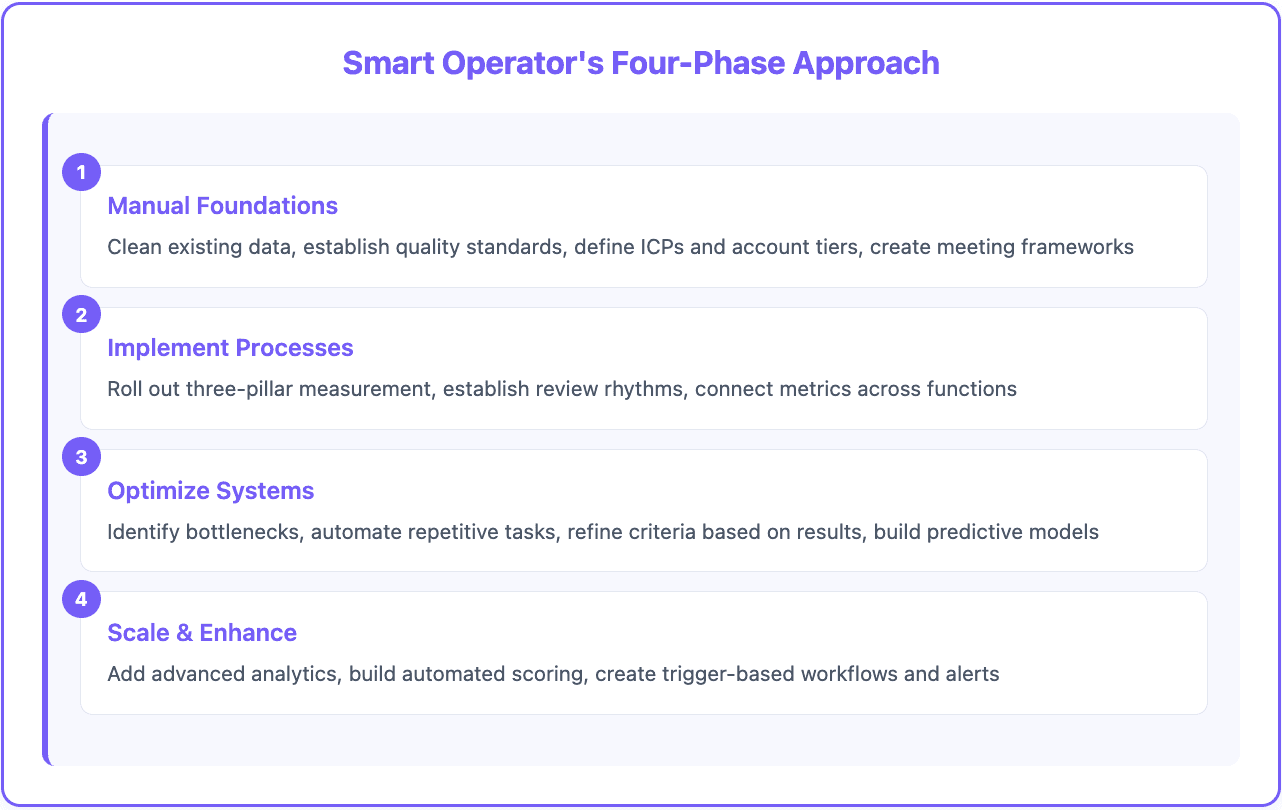
The Four-Phase Approach
Phase 1 establishes manual foundations. Clean existing data and establish quality standards, define ICPs and account tiers manually, create meeting types and qualification frameworks, then train teams on new data entry requirements.
Phase 2 implements processes. Roll out the three-pillar measurement system, establish weekly and monthly review rhythms, connect metrics across teams and functions, then begin tracking leading versus lagging indicators.
Phase 3 optimizes systems. Identify bottlenecks in data flow and reporting, automate repetitive tasks and workflows, refine qualification criteria based on results, then build predictive models from historical data.
Phase 4 scales and enhances. Layer in advanced analytics and prediction, build automated scoring and routing systems, create trigger-based workflows and alerts, then develop expansion and renewal forecasting.
Start simple. Build systems that work manually before automating anything.
How Data Enrichment Amplifies Every Pillar
Traditional revenue operations assume your data is complete and current. It's not.
Your CRM shows basic contact information, but it misses recent funding rounds or leadership changes, technology stack evolution and buying signals, competitive evaluations and vendor changes, plus hiring patterns and department growth.
This is where data enrichment improves each pillar:
Volume enhancement automatically surfaces decision maker contact information and reporting structure, recent role changes and promotion announcements, technology usage and implementation signals, plus company growth indicators and expansion activity.
Account intelligence provides real-time enrichment with intent signals showing active vendor evaluation, funding status and budget availability indicators, competitive landscape and vendor relationship changes, plus organizational structure and stakeholder mapping.
Accuracy amplification happens through automated validation including contact information verification and updates, company status and employment confirmation, technology usage validation and stack changes, plus competitive intelligence and market positioning.
Modern platforms like Databar integrate 90+ data providers to automatically enrich your existing systems with verified, current information. This turns static CRM records into dynamic intelligence that predicts opportunities and identifies risks.
The result: your three-pillar system operates with complete, current data instead of guessing.
Ask Questions While You’re Building
Most operators get paralyzed by planning. They want the perfect system before they start building anything.
The best approach: build first, then collaborate.
Start with what you have. Build a working version of the three-pillar system using your existing tools. Get data flowing. Create basic dashboards. Test the framework with real deals and activities.
Once you have something working—even if it's rough—then get input from your team. They can see what you've built and suggest improvements instead of theorizing about problems.
This approach creates momentum and gets results faster than endless planning sessions.
Your Starting Checklist
1 focuses on foundation work:
• Audit current data quality in your CRM
• Define Tier 1 account criteria based on closed-won analysis
• List meeting types that correlate with deal progression
2 builds measurement systems:
• Build basic volume tracking for activities and self-generated pipeline
• Create account scoring based on firmographic and behavioral signals
• Establish weekly data hygiene requirements
Week 3 implements validation:
• Implement validation alerts for deals missing key information
• Connect activity metrics to pipeline progression
• Start weekly team reviews using new framework
Week 4 refines and plans:
• Refine based on initial usage and team feedback
• Plan automation for repetitive tasks
• Identify next phase improvements
Perfect is the enemy of done. Build foundations that work, then iterate based on real usage.
Conclusion
Revenue operations isn't about having better dashboards. It's about building systems that turn individual effort into predictable outcomes.
The three-pillar framework gives you a practical approach to create operational foundations that scale. Start with one pillar. Get it working. Then expand.
Because the companies that can predict their revenue are the ones that control their growth.
Frequently Asked Questions
What's the difference between revenue operations and sales operations?
Sales operations focuses specifically on the sales process from prospecting to close, while revenue operations takes a holistic view of the entire customer lifecycle including marketing, sales, and customer success. RevOps aligns all revenue-generating teams around shared metrics and processes.
How long does it take to implement a revenue operations framework?
Most companies see initial results within 90 days using a phased approach. Week 1-4 focus on foundations, weeks 5-8 on process implementation, weeks 9-12 on optimization, and month 4+ on scaling. The key is starting simple and building systematically.
What tools do I need to build revenue operations?
You can start with your existing CRM and spreadsheets. Most companies successfully implement RevOps using HubSpot, Salesforce, or similar platforms plus tools like Zapier for automation. Avoid tool shopping—build processes first, then add technology that supports what's working.
What's the biggest mistake companies make with RevOps?
Trying to automate everything before building solid processes. The most successful implementations start manually, establish working systems, then layer in automation. Also, measuring too many metrics instead of focusing on the few that actually predict revenue outcomes.
When should a company invest in revenue operations?
Most companies benefit from RevOps around 10-20 employees when informal coordination breaks down. However, any company struggling with pipeline predictability, team alignment issues, or data silos can benefit regardless of size.
How does data enrichment fit into revenue operations?
Data enrichment amplifies all three pillars by automatically updating contact information, providing intent signals for account prioritization, and validating data accuracy. It transforms static CRM records into dynamic intelligence that predicts opportunities and identifies risks.
Recent articles
See all


