
Here's what separates high-performing revenue teams from everyone else: they obsess over pipeline quality, not just pipeline volume.
While most sales organizations celebrate hitting pipeline coverage ratios of 3x or 4x, the best teams ask different questions: Which deals will actually close? When will they close? What makes an opportunity truly qualified?
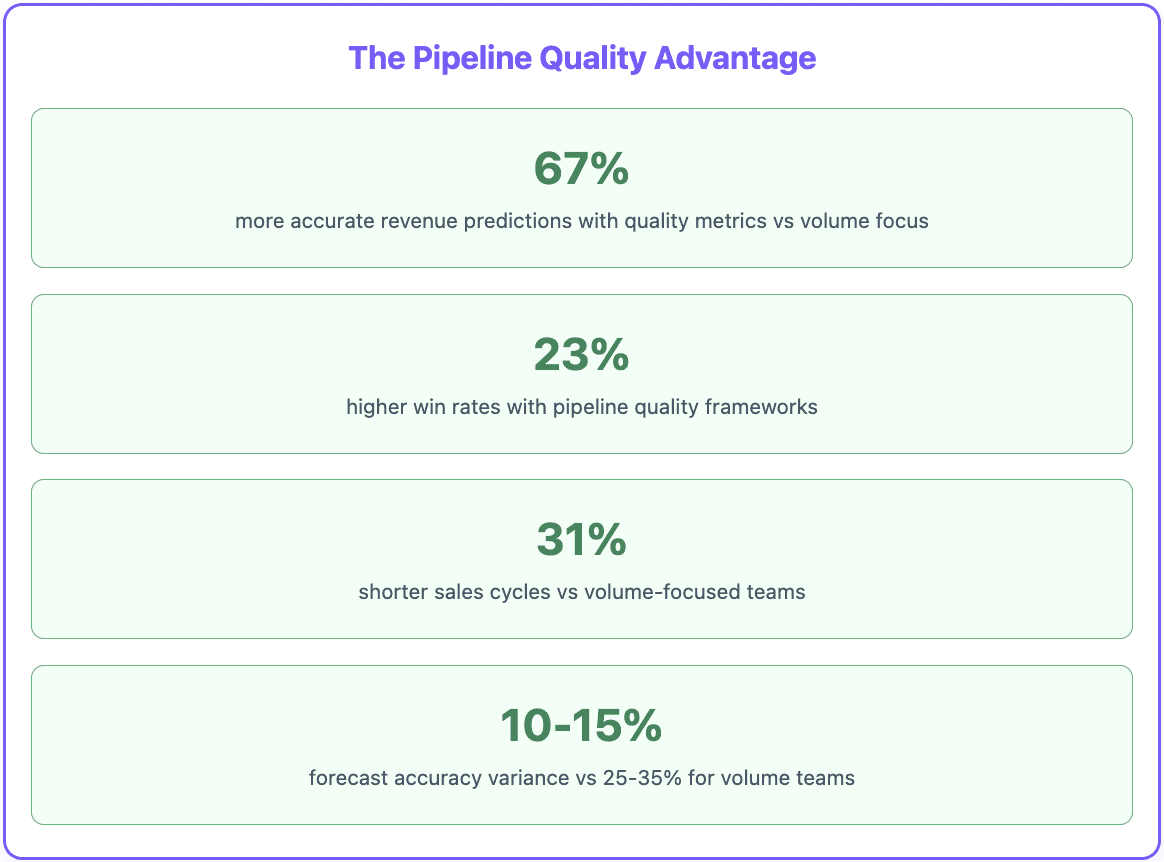
Here’s something that changes everything about sales forecasting: Teams measuring pipeline quality metrics achieve 67% more accurate revenue predictions than teams focused purely on volume.
The difference comes from understanding that not all pipeline is created equal. A $2M pipeline filled with properly qualified opportunities will outperform a $5M pipeline bloated with wishful thinking.
Modern revenue operations requires a framework that distinguishes between deals that look good on paper and opportunities that actually convert to revenue.
The Pipeline Quality Crisis Every Revenue Team Faces
Every sales leader recognizes this scenario: Your CRM shows $3M in pipeline for the quarter. Your coverage ratio looks healthy at 3.5x. Your team projects confidence.
Then reality hits. By month two, half your "committed" deals have slipped. Your forecast accuracy drops to 60%. Board meetings become uncomfortable conversations about missed projections.
The problem isn't pipeline volume—it's pipeline quality measurement.
Most revenue teams track the wrong metrics. They measure total pipeline value, deal count, and coverage ratios without understanding which opportunities actually have a realistic chance of closing in the predicted timeframe.
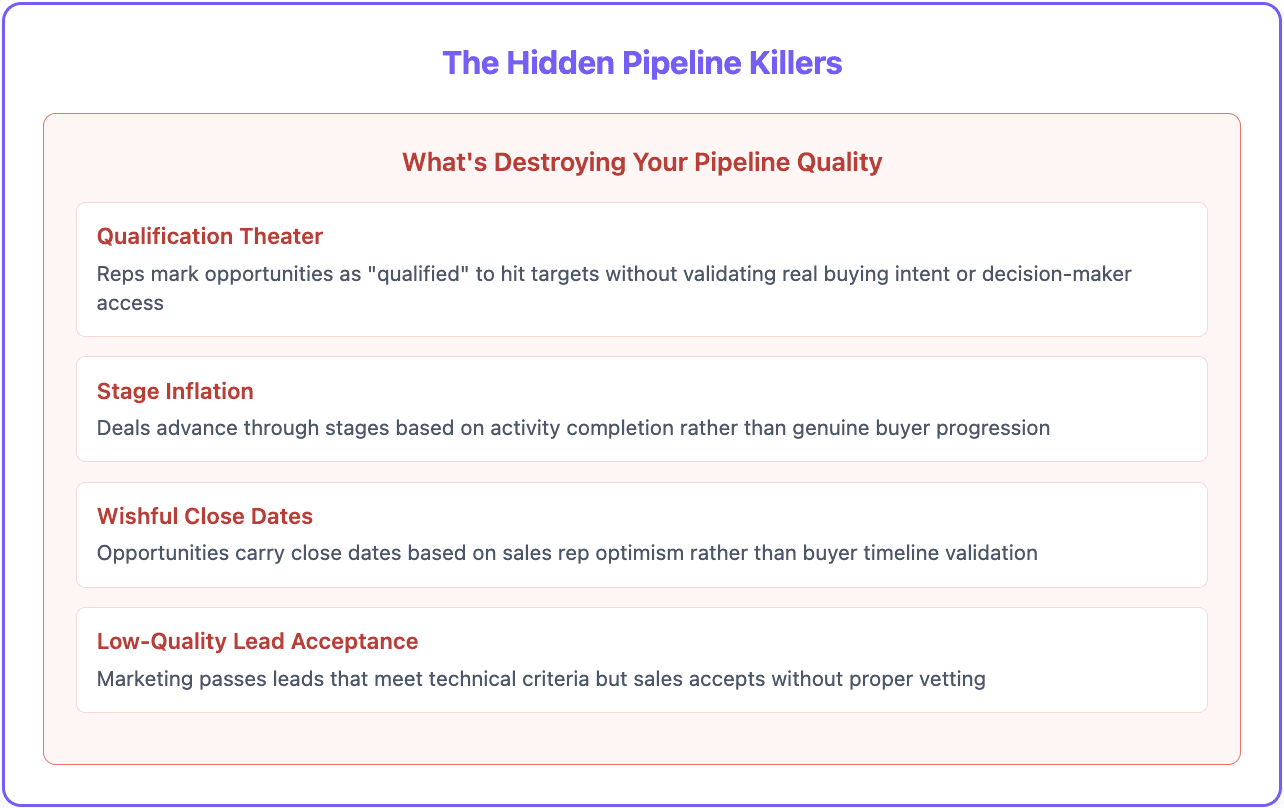
The Hidden Pipeline Killers
Qualification Theater: Sales reps mark opportunities as "qualified" to hit pipeline generation targets, but they haven't validated real buying intent, decision-maker access, or budget authority.
Stage Inflation: Deals advance through pipeline stages based on activity completion rather than genuine buyer progression. Having a "discovery call" doesn't automatically mean an opportunity belongs in the "discovery" stage.
Wishful Close Dates: Opportunities carry close dates based on sales rep optimism rather than buyer timeline validation. When these dates prove unrealistic, entire forecasts collapse.
Low-Quality Lead Acceptance: Marketing passes leads that technically meet qualification criteria, but sales accepts them without proper vetting. These "opportunities" consume resources while delivering low conversion rates.
Why Traditional Pipeline Metrics Fail
Traditional pipeline measurement focuses on lagging indicators: total value, deal count, win rates calculated after deals close. These metrics tell you what happened, not what's about to happen.
Pipeline quality metrics are leading indicators. They predict which deals will close, when they'll close, and why some opportunities are more likely to convert than others.
Research from Sales Benchmark Index shows that companies using pipeline quality frameworks achieve 23% higher win rates and 31% shorter sales cycles compared to teams measuring only volume metrics.
Volume vs. Quality: Why Most Pipeline Metrics Mislead
The fundamental problem with traditional pipeline management is the volume bias—the assumption that more opportunities automatically lead to more revenue.
This thinking creates dangerous behaviors across revenue teams:
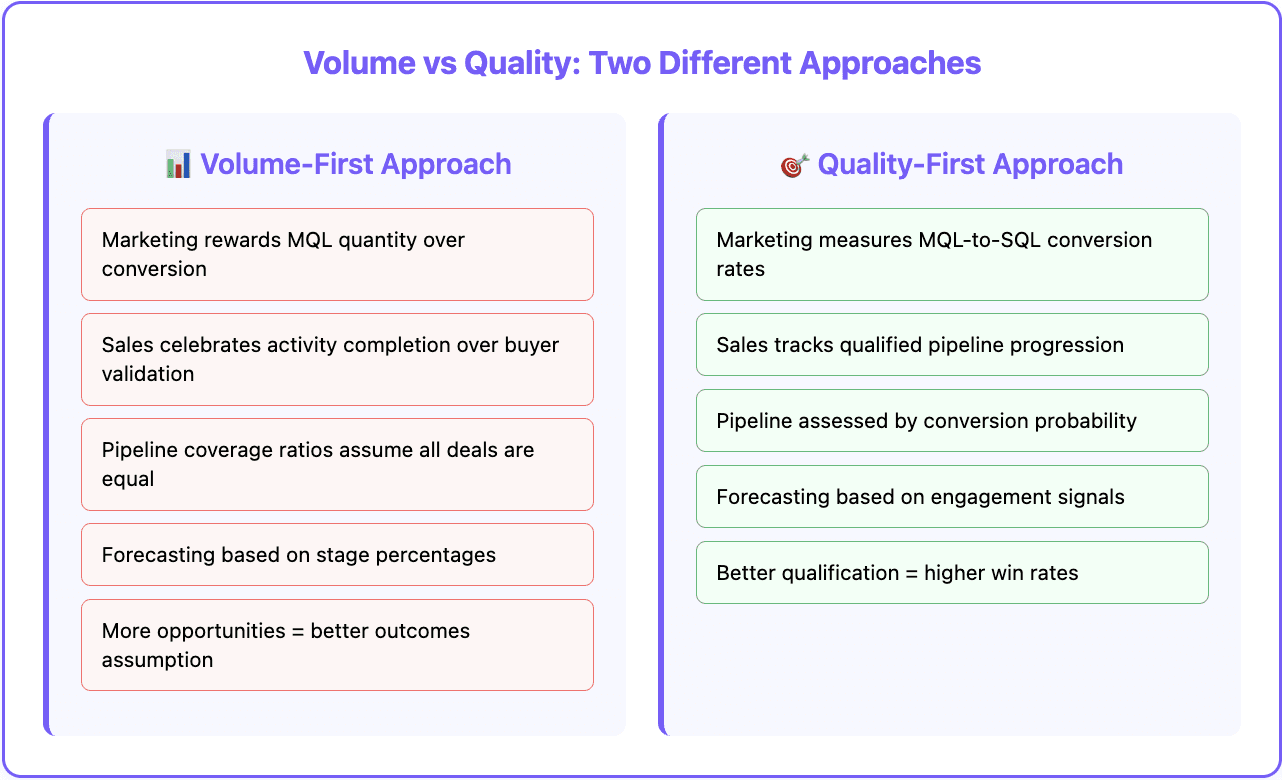
Marketing's Volume Obsession
Marketing teams get rewarded for qualified pipeline creation based on lead quantity. They optimize for MQL volume, lead generation rates, and pipeline contribution without measuring downstream conversion quality.
The result: inflated top-of-funnel metrics that don't correlate with revenue outcomes. Marketing celebrates generating 1,000 MQLs while sales struggles to convert even 50 into actual opportunities.
Sales' Activity Trap
Sales development teams focus on meeting generation, call volume, and email sequence completion. Account executives celebrate moving deals through stages based on activity completion rather than buyer validation.
But activity doesn't equal progress. Having 20 discovery calls doesn't matter if none of those prospects have buying authority or validated need.
The Quality vs. Quantity Framework
High-performing revenue teams flip this equation. Instead of optimizing for maximum volume, they optimize for maximum conversion probability at each stage.
Quality-First Approach:
Marketing measures MQL-to-SQL conversion rates, not just MQL volume
Sales development tracks meeting-to-opportunity conversion, not just meeting volume
Account executives measure qualified pipeline progression, not just total pipeline value
Revenue operations predicts close probability based on engagement signals, not just stage progression
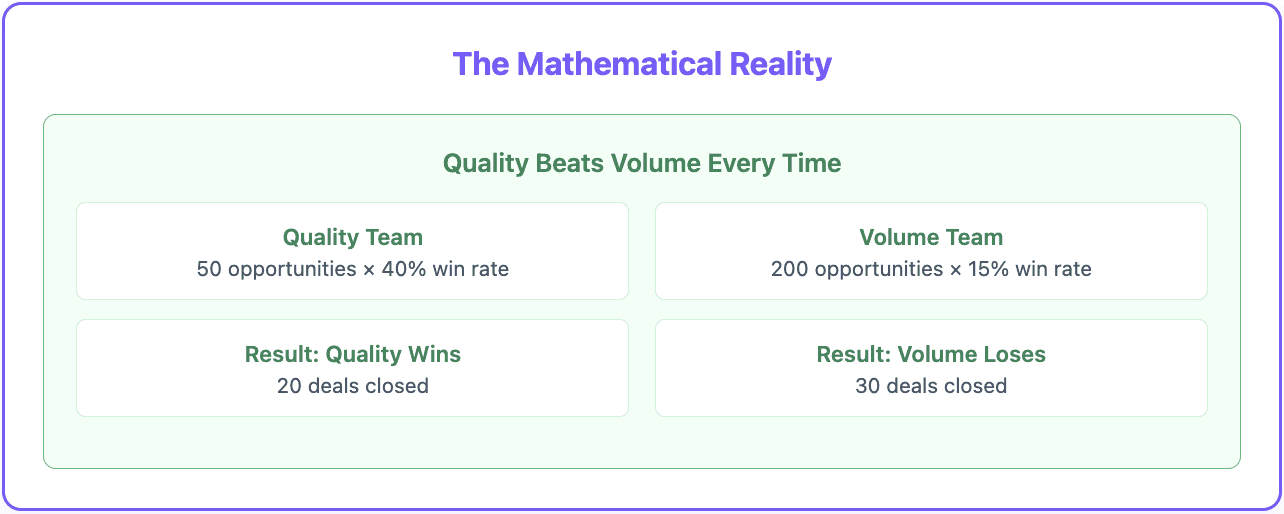
The Mathematical Reality: A sales team with 50 highly qualified opportunities at 40% win rate generates more revenue than a team with 200 poorly qualified opportunities at 15% win rate.
Quality-focused teams spend more time on fewer, better opportunities. Volume-focused teams spread thin across opportunities that rarely convert.
The Three-Gate Pipeline Quality Framework
Based on analysis of the highest-performing revenue operations teams, we've identified a three-gate framework that transforms pipeline measurement from volume reporting to quality prediction.
This framework, inspired by top-tier revenue operations practices, creates quality checkpoints that prevent low-probability opportunities from inflating your pipeline and corrupting your forecasts.
Gate 1: Volume and Activity Validation
The first gate establishes baseline activity and engagement requirements before any opportunity enters your qualified pipeline.
Activity Depth Requirements: Opportunities must demonstrate multiple engagement types across different stakeholders. A single demo doesn't qualify—you need discovery calls, technical assessments, economic buyer engagement, and stakeholder mapping completion.
Prospecting Quality Standards: Account executives must contribute to their own pipeline generation through targeted prospecting, not just accept marketing leads. Self-generated opportunities often convert at higher rates because AEs pre-qualify accounts before investing time.
Meeting Progression Gates: Different types of meetings serve different qualification purposes. Discovery calls validate need and stakeholders. Technical assessments confirm solution fit. Economic buyer meetings validate budget and timeline. Each meeting type must be completed before advancing to the next pipeline stage.
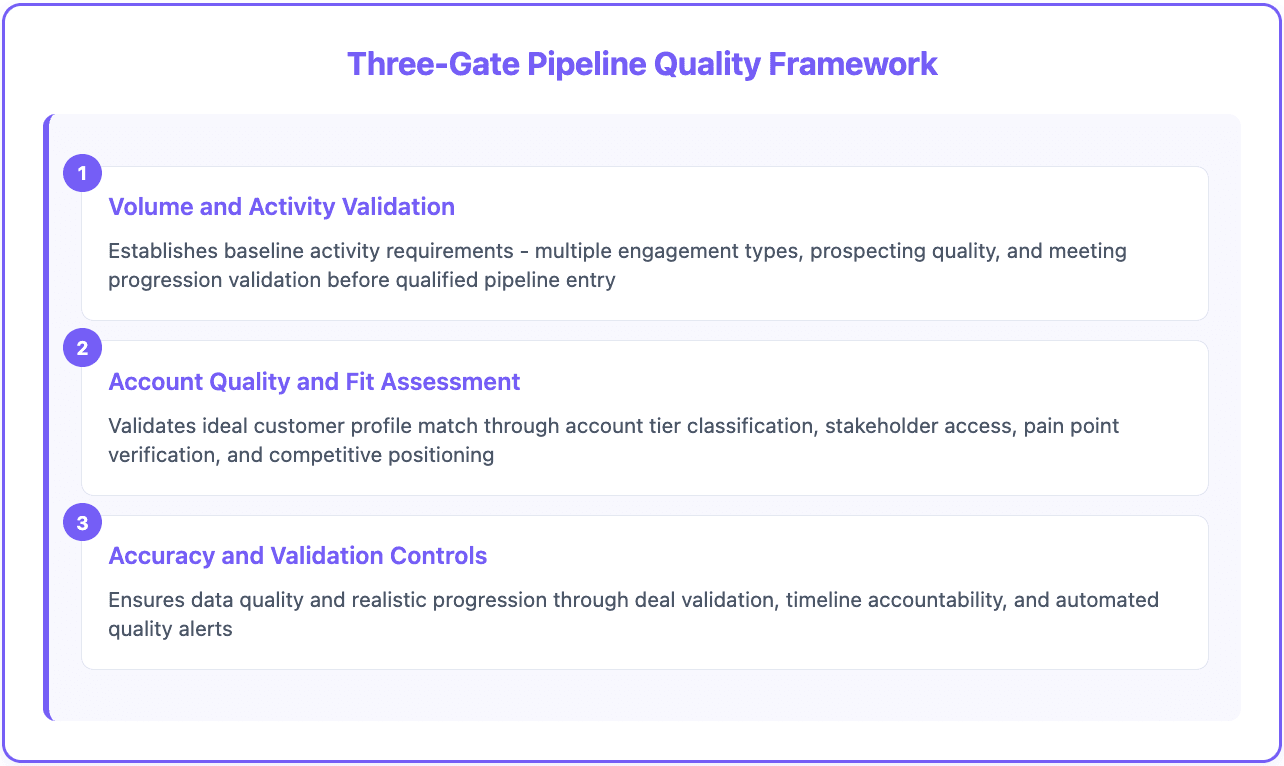
Gate 2: Account Quality and Fit Assessment
The second gate validates whether accounts match your ideal customer profile and have characteristics that correlate with successful deals.
Account Tier Classification: Opportunities get classified into tier 1, tier 2, or tier 3 based on company size, industry fit, geographic location, and growth indicators. Higher-tier accounts receive priority and deeper qualification.
Stakeholder Access Validation: Qualified opportunities must include identified decision-makers and economic buyers, not just end users or influencers. Account executives must demonstrate access to people who can actually sign contracts.
Pain Point Verification: Opportunities must articulate specific business problems your solution solves, quantified impact of those problems, and timeline urgency for resolution. Generic interest doesn't qualify as validated need.
Competitive Positioning: Understanding the competitive landscape for each opportunity, including incumbent solutions, evaluation criteria, and your positioning relative to alternatives.
Gate 3: Accuracy and Validation Controls
The third gate ensures that opportunities maintain data quality and realistic progression timelines throughout the sales process.
Deal Validation Requirements: Regular validation of opportunity details, stakeholder information, budget confirmation, and timeline verification. Opportunities that can't be validated get flagged for additional qualification or removal.
Timeline Accountability: Close dates must be justified based on buyer timeline validation, not sales rep wishful thinking. Deals with extended close date history get marked as lower probability.
Automated Quality Alerts: Systems that flag opportunities showing risk signals—extended time in stage, lack of stakeholder engagement, missed progression milestones, or incomplete qualification data.
Activity, Accounts, and Accuracy: Building Your Quality Foundation
The most effective sales pipeline quality assessment systems measure three interconnected dimensions that predict deal success: comprehensive activity tracking, rigorous account evaluation, and validated accuracy controls.
Activity Quality Measurement
Meeting Type Distribution: Track the variety and depth of interactions for each opportunity. High-quality opportunities include discovery meetings, technical demos, stakeholder interviews, economic buyer discussions, and reference calls.
Engagement Breadth: Measure stakeholder participation across different organizational levels and departments. Single-threaded deals carry higher risk than opportunities with multiple engaged stakeholders.
Progression Consistency: Monitor whether activities align with stated deal stages. An opportunity in "proposal" stage should have completed discovery, technical validation, and stakeholder alignment activities.
Response Rate Tracking: Quality opportunities demonstrate consistent stakeholder responsiveness to meeting requests, email communications, and follow-up actions.
Account Assessment Framework
Ideal Customer Profile Scoring: Quantify how well each opportunity matches your highest-converting customer characteristics. Include company size, industry, growth stage, technology stack, and geographic factors.
Decision-Making Authority: Validate that identified stakeholders have actual authority to make purchase decisions or can access decision-makers within their organization.
Budget Verification: Confirm that accounts have budget allocated for your solution category, not just general interest in solving problems.
Implementation Capacity: Assess whether accounts have the resources, timeline, and organizational readiness to successfully implement your solution.
Validation and Accuracy Controls
Data Completeness Scoring: Track what percentage of critical opportunity fields contain validated information. Incomplete data correlates with lower win probability.
Timeline Validation: Regular confirmation that buyer timelines align with forecasted close dates. Opportunities with repeatedly extended close dates get probability adjustments.
Competitive Intelligence: Maintain current information about competitive alternatives being evaluated and your positioning relative to other options.
Stakeholder Engagement Monitoring: Track frequency and quality of communications with opportunity stakeholders. Declining engagement often predicts deal stagnation or loss.
Essential Pipeline Quality Metrics That Predict Revenue
Traditional pipeline metrics like total value and coverage ratio tell you about pipeline volume. Pipeline quality metrics tell you about revenue probability.
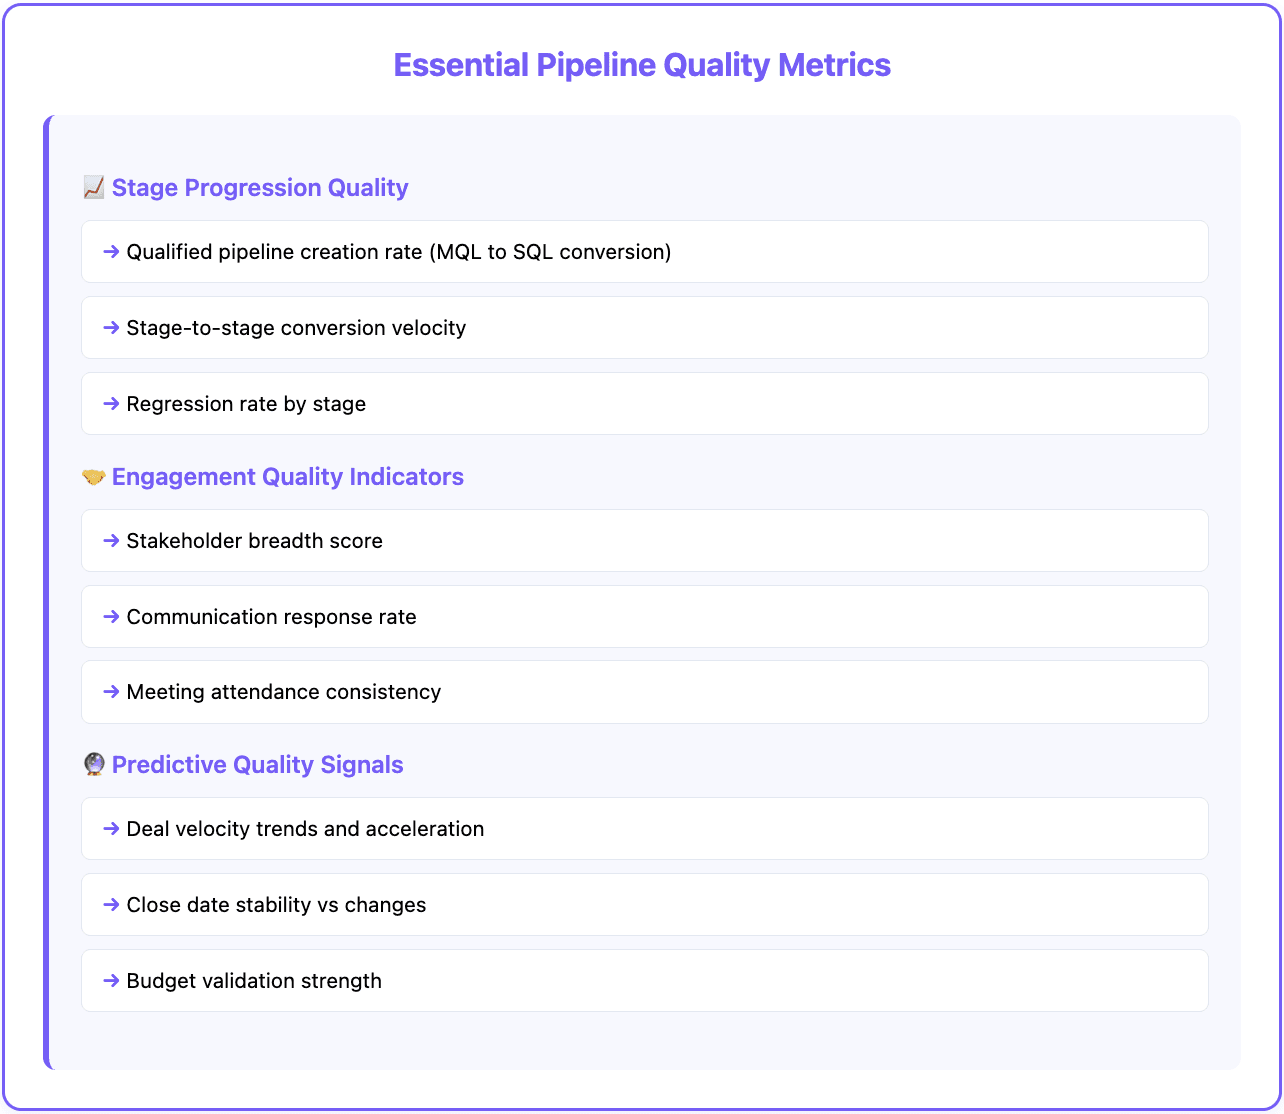
Stage Progression Quality
Qualified Pipeline Creation Rate: Percentage of marketing leads that become sales-validated opportunities. Higher conversion rates indicate better lead quality and alignment between marketing and sales qualification criteria.
Stage-to-Stage Conversion Velocity: Time required for opportunities to progress from one stage to the next, broken down by deal characteristics. Faster progression often indicates stronger qualification and buying urgency.
Regression Rate by Stage: Percentage of opportunities that move backward in the sales process, indicating qualification issues or changing buyer priorities.
Stage Skipping Analysis: Opportunities that advance through multiple stages quickly may indicate rushed qualification or exceptionally strong fit.
Engagement Quality Indicators
Stakeholder Breadth Score: Number of unique contacts engaged per opportunity, weighted by organizational authority and decision-making influence.
Communication Response Rate: Percentage of outbound communications that receive responses from opportunity stakeholders, indicating engagement level and buying interest.
Meeting Attendance Rate: Consistency of stakeholder participation in scheduled meetings, demos, and calls throughout the sales process.
Content Engagement Depth: Tracking which sales materials, case studies, and technical resources stakeholders consume during the evaluation process.
Predictive Quality Signals
Deal Velocity Trends: Acceleration or deceleration of deal progression compared to historical patterns for similar opportunities.
Close Date Stability: Frequency of close date changes throughout the sales process. Stable dates indicate realistic buyer timelines.
Competitive Displacement Risk: Early indicators of competitive threats based on stakeholder behavior, evaluation criteria changes, or communication patterns.
Budget Validation Strength: Quality of budget verification, including confirmed allocation, approval process understanding, and procurement requirements.

Beyond Win Rate: Advanced Quality Indicators
While win rate provides valuable historical perspective, opportunity qualification gates and advanced quality indicators offer predictive insights that enable proactive pipeline management.
Risk Prediction Metrics
Deal Stagnation Indicators: Opportunities that remain in the same stage beyond historical averages for similar deals, suggesting qualification issues or buyer prioritization changes.
Stakeholder Engagement Decline: Decreasing response rates, meeting cancellations, or delayed communications that predict deal risk before formal rejections occur.
Close Date Extension Patterns: Opportunities with multiple close date changes carry higher loss probability and require additional qualification validation.
Competitive Evaluation Expansion: When buyers expand their vendor evaluation beyond the original consideration set, indicating potential requirements changes or budget scrutiny.
Quality Scoring Models
Opportunity Health Score: Composite scoring that combines activity quality, stakeholder engagement, timeline consistency, and qualification completeness into a single predictive indicator.
Conversion Probability Modeling: Machine learning models that analyze historical deal data to predict close probability based on current opportunity characteristics and engagement patterns.
Pipeline Quality Index: Organization-wide measurement that tracks the overall health and predictability of your sales pipeline, enabling trend analysis and early warning systems.
Account Propensity Scoring: Predictive models that identify which accounts in your addressable market show characteristics similar to your best customers.
Advanced Analytics Applications
Cohort Analysis by Quality: Tracking how opportunities with different quality scores perform over time, enabling refinement of scoring models and qualification criteria.
Attribution Analysis: Understanding which activities, engagement types, and qualification steps most strongly correlate with successful deal outcomes.
Segmentation Performance: Comparing pipeline quality metrics across different market segments, deal sizes, and customer types to optimize resource allocation.
This is where modern data enrichment platforms like Databar provide strategic advantage. By automatically enriching opportunity records with comprehensive company intelligence, technology stack data, and buying intent signals, revenue teams can build more sophisticated quality scoring models without manual research overhead.
How Quality Gates Improve Forecasting Accuracy
Traditional forecasting relies on stage-based probability percentages that rarely reflect actual deal outcome likelihood. Quality gate frameworks create dynamic probability adjustments based on real qualification validation.
Dynamic Probability Adjustment
Instead of static stage probabilities (Discovery: 20%, Proposal: 50%, Negotiation: 75%), quality frameworks adjust probabilities based on:
Qualification Completeness: Opportunities with full stakeholder identification, validated budget, and confirmed timeline carry higher probability than deals missing these elements.
Engagement Quality: Deals with consistent stakeholder participation and responsive communication receive probability increases relative to single-threaded opportunities.
Timeline Validation: Opportunities with buyer-confirmed timelines maintain higher probability than deals with sales-projected close dates.
Competitive Position: Understanding your position relative to alternatives enables more accurate probability assessment.
Forecast Reliability Improvement
Companies implementing quality gate frameworks report significant improvements in forecast accuracy:
Reduced Forecast Variance: Quality-focused teams achieve forecast accuracy within 10-15% of targets, compared to 25-35% variance for volume-focused teams.
Earlier Risk Identification: Quality metrics predict deal problems 30-60 days before traditional indicators, enabling proactive management.
Improved Resource Allocation: Understanding which opportunities are truly qualified enables better territory planning, account assignment, and support resource deployment.
Executive Confidence: More accurate forecasting improves board reporting, investor communication, and strategic planning effectiveness.
Implementation Success Factors
Executive Alignment: Quality frameworks require organizational commitment to measuring and rewarding quality over volume, which demands leadership support.
Cross-Functional Coordination: Marketing, sales development, and account management must align on quality definitions and measurement standards.
Technology Integration: Quality measurement requires integrated systems that capture engagement data, stakeholder information, and validation milestones automatically.
Continuous Refinement: Successful teams regularly analyze quality metric performance and refine scoring models based on actual deal outcomes.
Building Your Pipeline Quality Assessment System
Creating an effective sales pipeline quality assessment requires systematic approach to data capture, analysis, and action.
Technology Infrastructure Requirements
Integrated CRM Foundation: Your customer relationship management system must capture not just deal information, but comprehensive engagement history, stakeholder mapping, and qualification milestone completion.
Activity Tracking Automation: Email communications, meeting participation, content engagement, and document sharing should be automatically logged and analyzed for quality indicators.
Data Enrichment Integration: Automated enhancement of account and contact records with firmographic data, technographic intelligence, and buying intent signals.
Analytics and Reporting Platform: Business intelligence tools that can process quality metrics, create predictive models, and generate actionable insights for sales management.
Quality Measurement Implementation
Baseline Metric Establishment: Before implementing quality frameworks, measure current performance across traditional metrics to establish improvement benchmarks.
Quality Scoring Model Development: Create weighted scoring systems that combine activity quality, account fit, and validation completeness into predictive opportunity scores.
Alert and Notification Systems: Automated alerts when opportunities show risk signals, quality score changes, or validation milestone gaps.
Dashboard and Reporting Design: Executive, management, and rep-level reporting that makes quality metrics actionable for different organizational roles.
Process Integration
Sales Process Alignment: Quality gates must integrate with existing sales methodology and stage progression requirements, not create parallel tracking systems.
Coaching and Training: Sales management needs training on quality metric interpretation and coaching frameworks that improve qualification effectiveness.
Incentive Alignment: Compensation and recognition systems should reward quality pipeline generation and progression, not just volume metrics.
Feedback Loop Creation: Regular analysis of quality metric performance versus actual deal outcomes to refine scoring models and qualification criteria.
What's Next For RevOps
The future belongs to revenue teams that measure what matters: pipeline quality that predicts revenue, not pipeline volume that creates false confidence.
Building pipeline quality measurement isn't about adding complexity to your sales process. It's about creating clarity that enables better decisions, accurate forecasting, and predictable revenue growth.
The companies that master pipeline quality frameworks will dominate their markets while competitors struggle with inflated pipelines that never convert to revenue.
Start measuring what matters. Build quality gates that work. Create pipeline intelligence that drives results.
Because in modern revenue operations, prediction beats hope every time.
Frequently Asked Questions
What's the difference between pipeline quality metrics and traditional pipeline metrics?
Traditional pipeline metrics measure volume—total pipeline value, deal count, coverage ratios. Pipeline quality metrics measure conversion probability—engagement depth, stakeholder access, qualification completeness, and timeline validation. Quality metrics predict which deals will close, while volume metrics only show how much potential revenue exists.
How do quality gates improve forecast accuracy?
Quality gates create dynamic probability adjustments based on actual qualification validation rather than static stage percentages. Instead of assuming 50% probability for all "proposal stage" deals, quality frameworks adjust probability based on stakeholder engagement, timeline validation, and qualification completeness. This typically improves forecast accuracy by 15-25%.
What's the most important pipeline quality metric to start measuring?
Qualified pipeline creation rate—the percentage of marketing leads that become sales-validated opportunities. This metric reveals the quality of your top-of-funnel while predicting bottom-of-funnel performance. Teams with high MQL-to-SQL conversion rates typically achieve better overall win rates and shorter sales cycles.
How do quality gates affect sales rep behavior?
Quality gates initially require more upfront qualification work but ultimately make sales reps more efficient. Instead of pursuing low-probability opportunities, reps focus on properly qualified deals with higher win rates. This typically reduces total activity volume while increasing revenue per opportunity.
What technology is required to implement pipeline quality measurement?
You need integrated CRM with comprehensive activity tracking, automated data enrichment for account intelligence, and analytics platforms for quality scoring. Most successful implementations combine CRM platforms (Salesforce, HubSpot) with data enrichment tools (like Databar) and business intelligence systems for reporting and analysis.
How do pipeline quality metrics affect marketing and sales alignment?
Quality metrics create shared accountability for conversion outcomes. Marketing gets measured on MQL-to-SQL conversion rates, not just MQL volume. Sales gets measured on qualified pipeline progression, not just pipeline value. This alignment typically improves lead quality, reduces marketing waste, and increases sales efficiency.
Recent articles
See all


