How to create charts and maps with live data and no code
Create live models of your data with interactive charts and maps.
Playbooks & Inspirationby DatabarJanuary 22, 2023
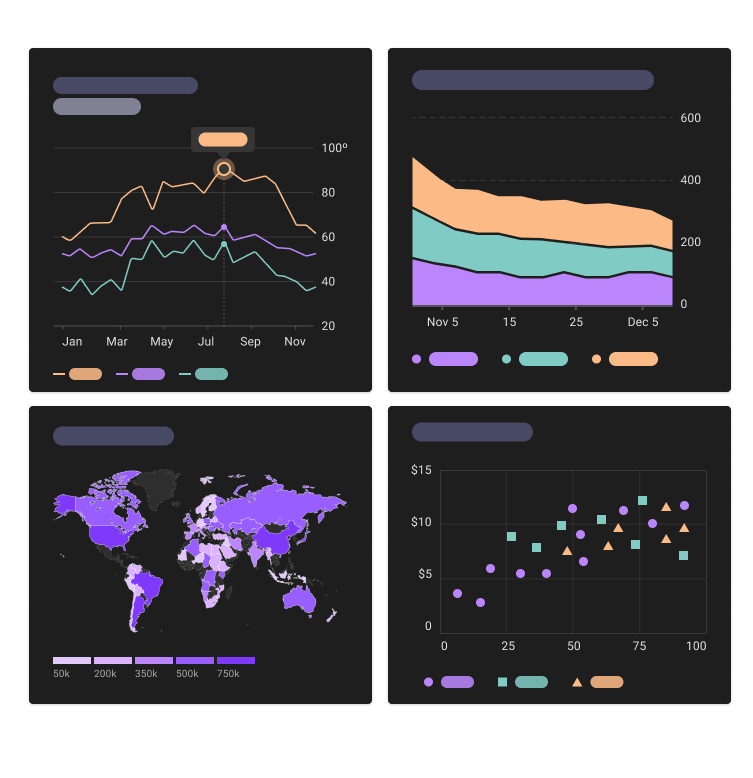
Creating visualizations can take hours, and creating them with live data is even harder and often takes hours to set up. Visual representations of data can help teams, analysts, and readers get insights across thousands of rows of data, visually identify trends, and dig deeper into the data that's being visualized. Live visualizations like the ones below are even better - they increase engagement through interactive actions, can be used to automate visual representations of data.
The Databar.ai Chart Tool
Along with accessing thousands of no-code APIs, Databar.ai's chart tool allows users to model their data and customize it exactly how they want. Keep reading to learn how to model your API data with Databar.ai with charts, graphs, maps, tables, and more!
Create a Table
1. For instructions on how to create a table, click here
Create a Live Chart
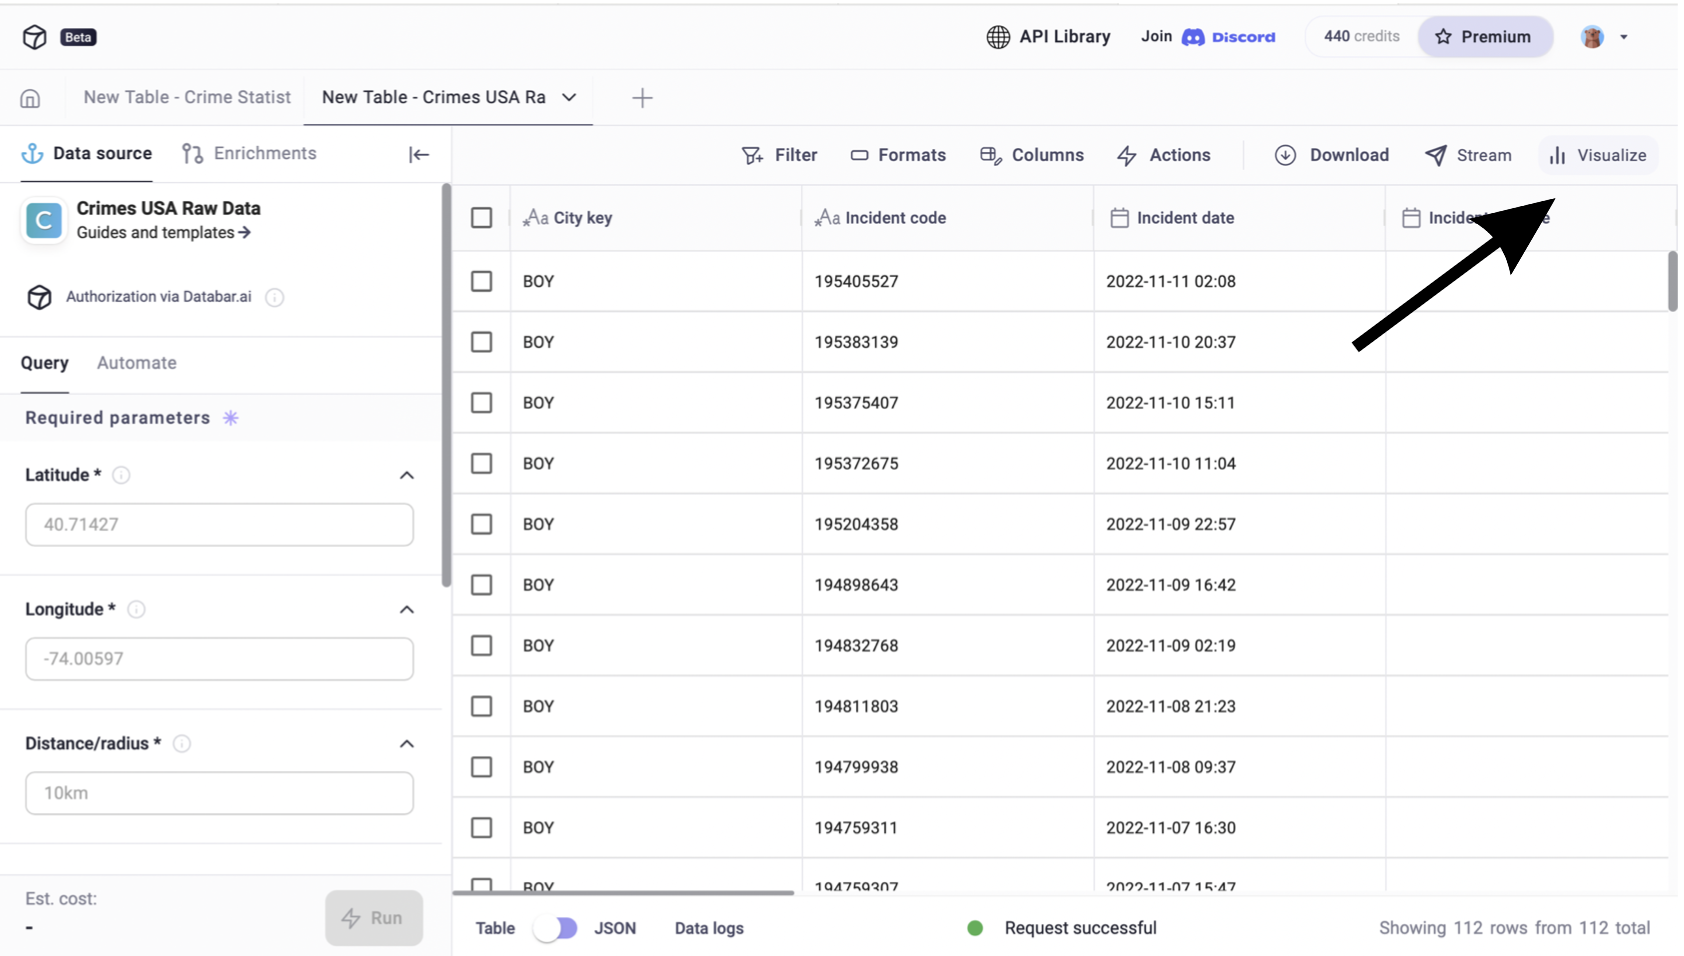
1. Open the Databar.ai chart tool. You could also hit the "Visualize" button on the top right of the table you're working on.
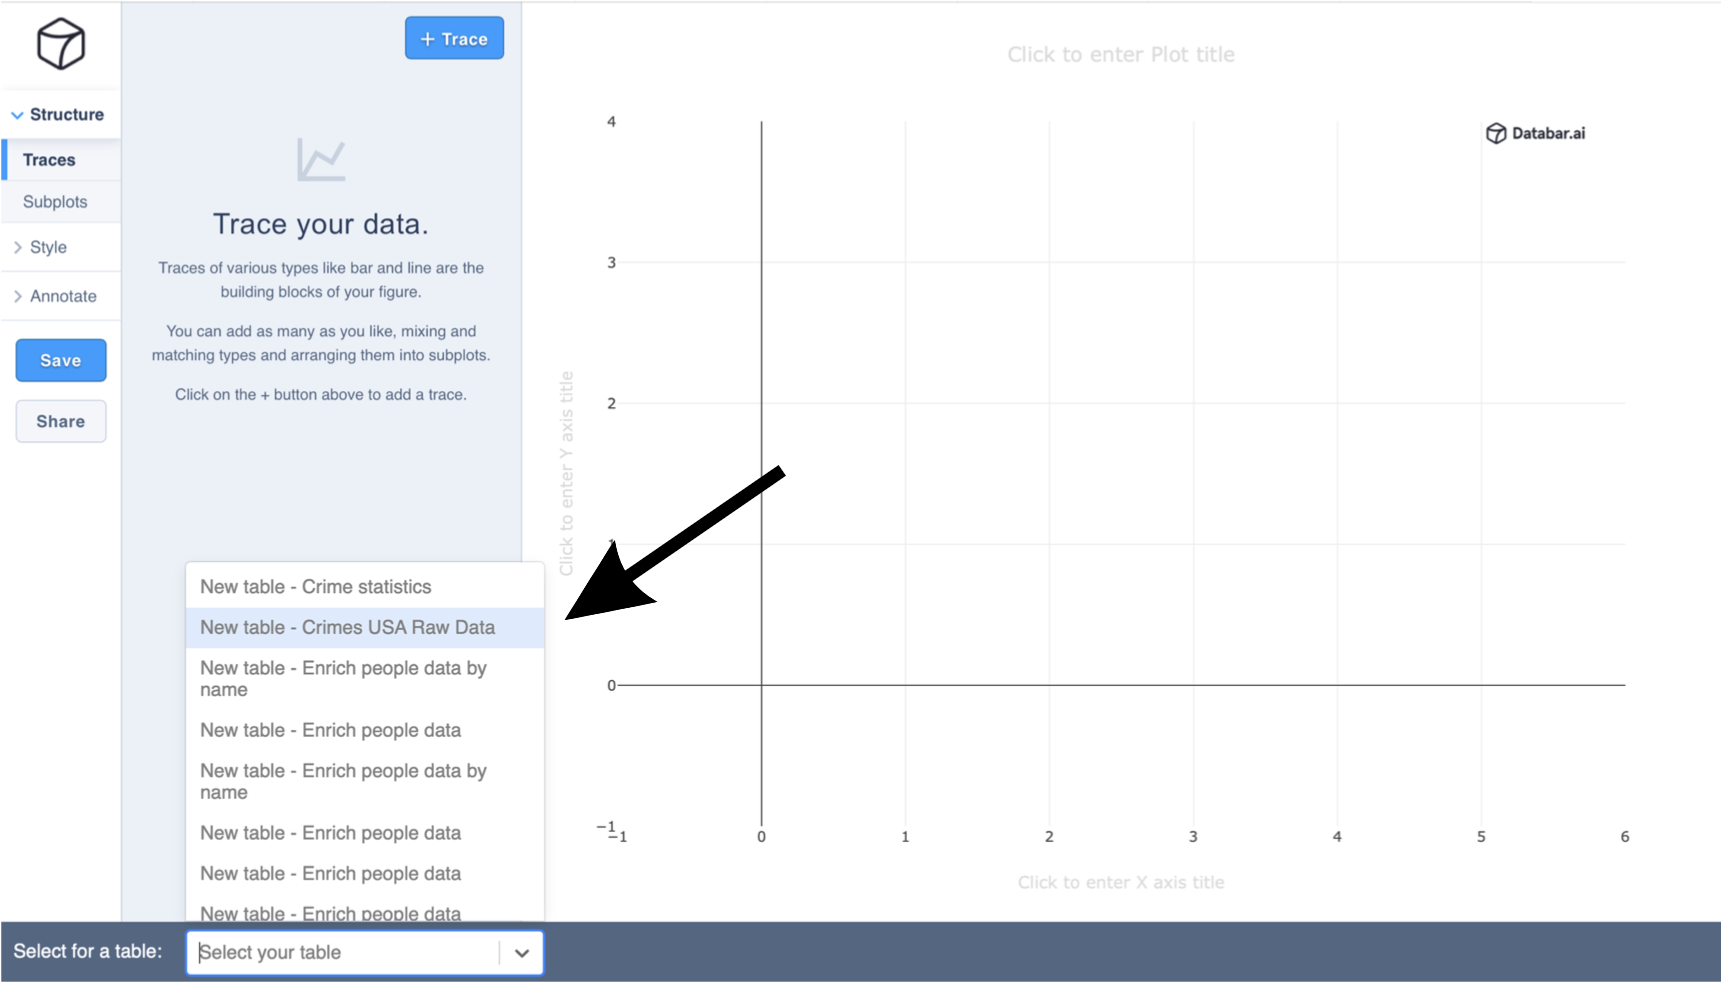
2. Select which data table you’d like to model via the dropdown on the bottom left of the screen if you are starting from the chart tool..
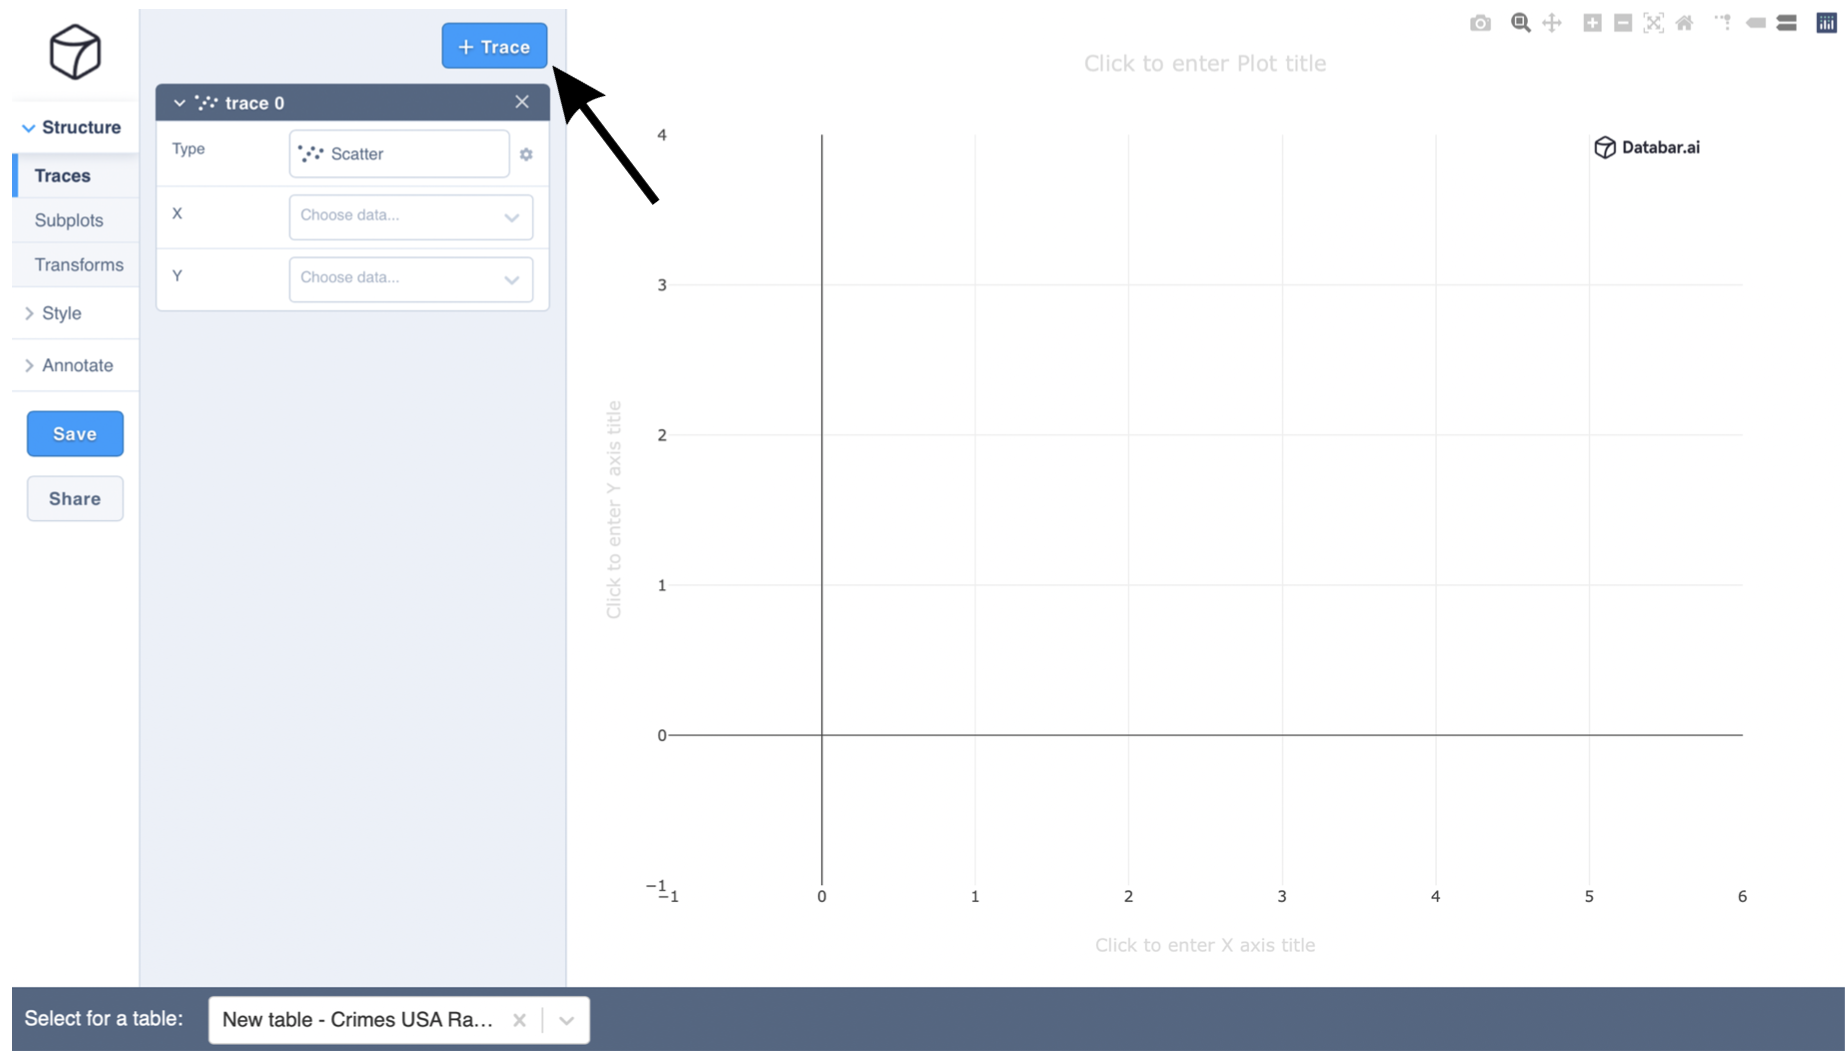
3. After selecting your table, add a trace by clicking the blue "Trace" button on the left of the screen.
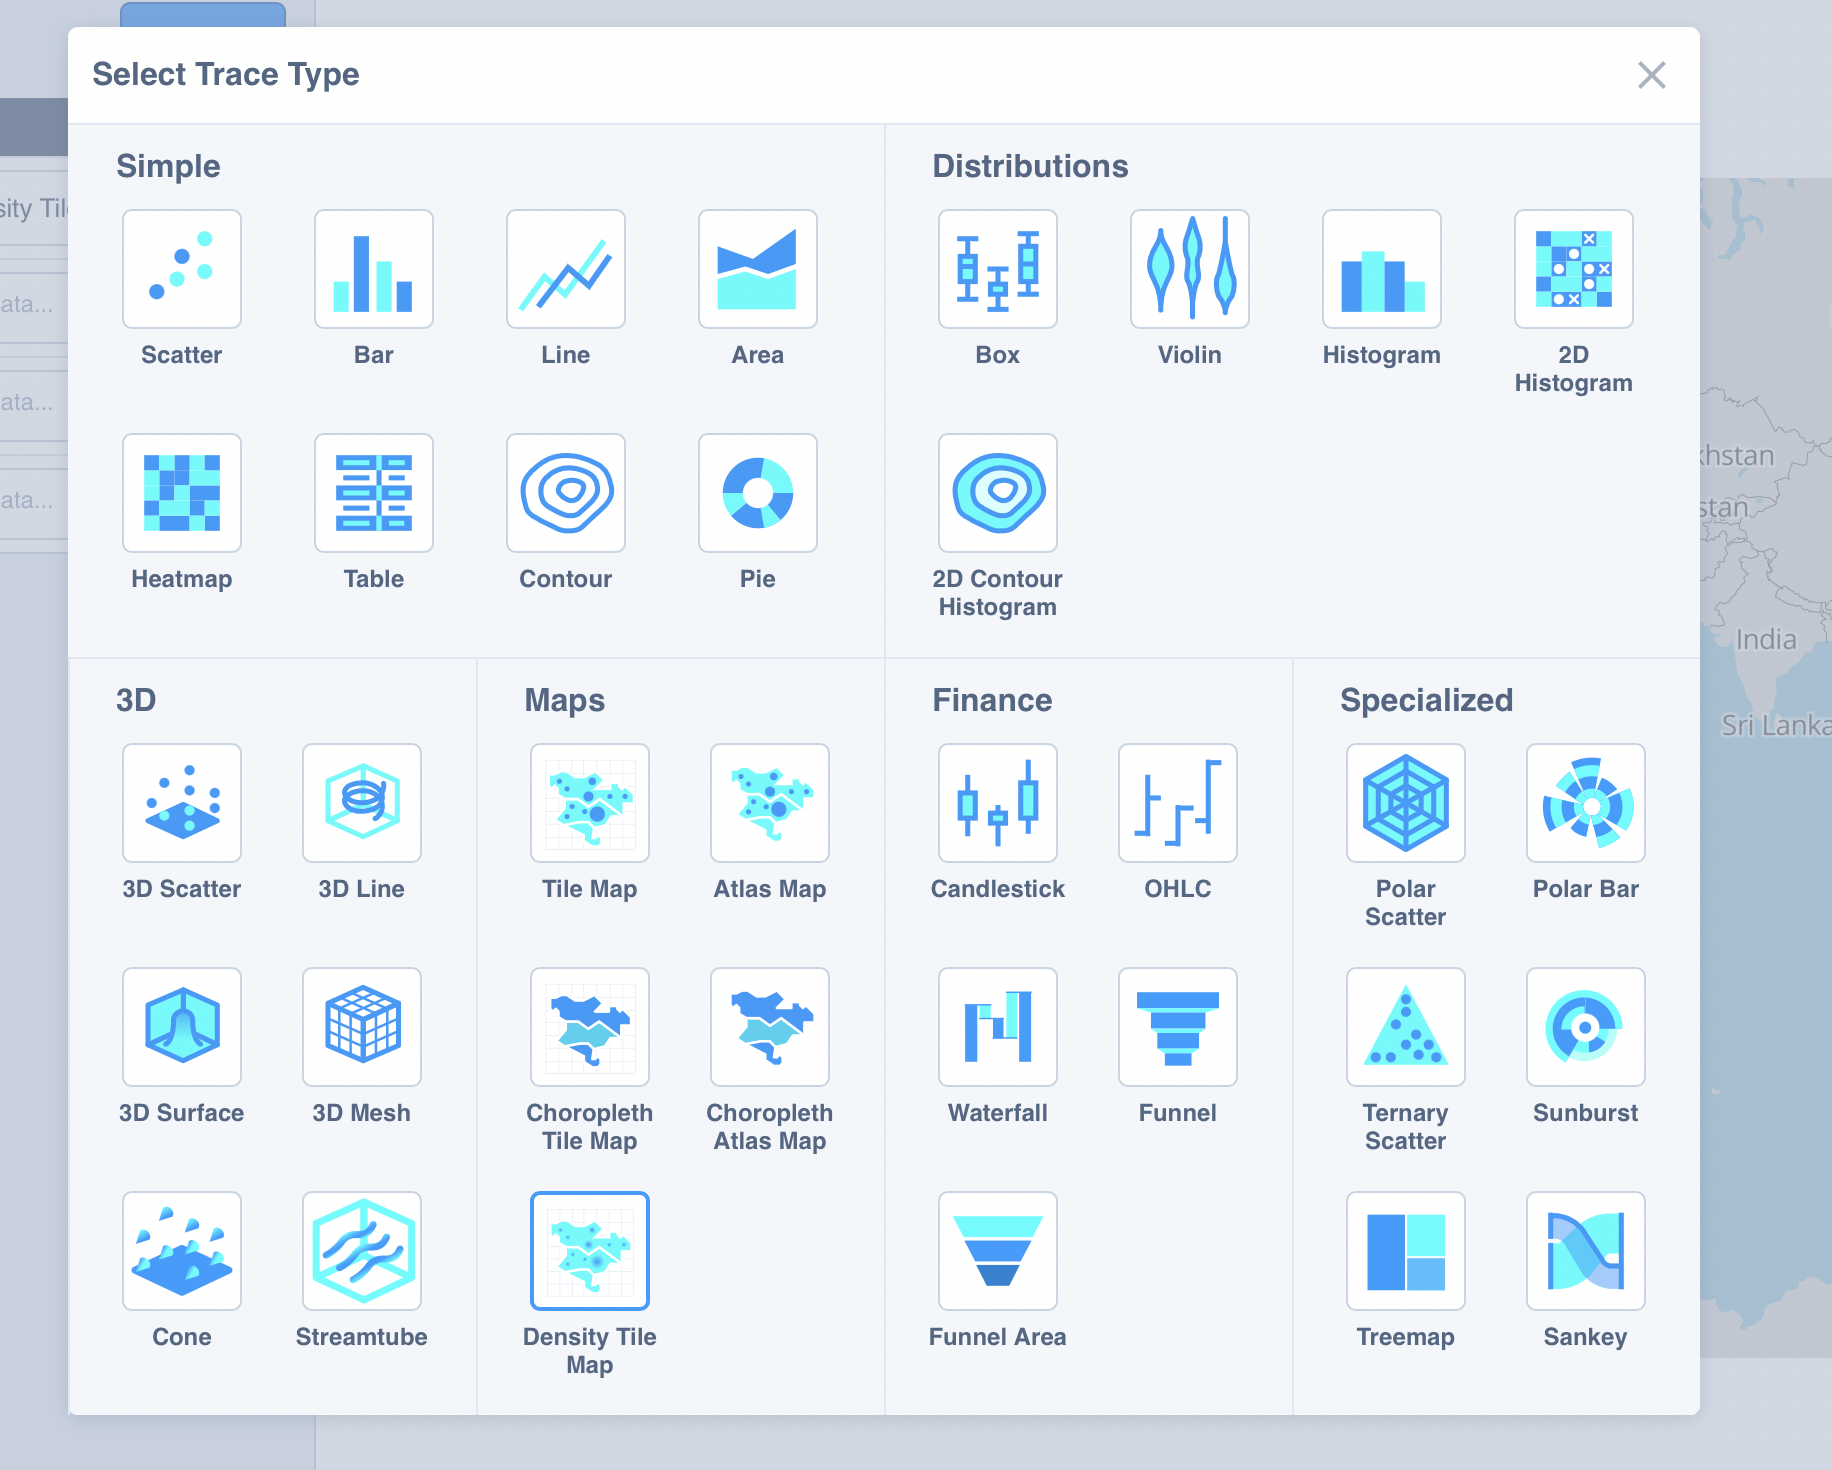
4. Choose the type of graph or table you’d like to create. For this example, we are making a Density Title Map to map out c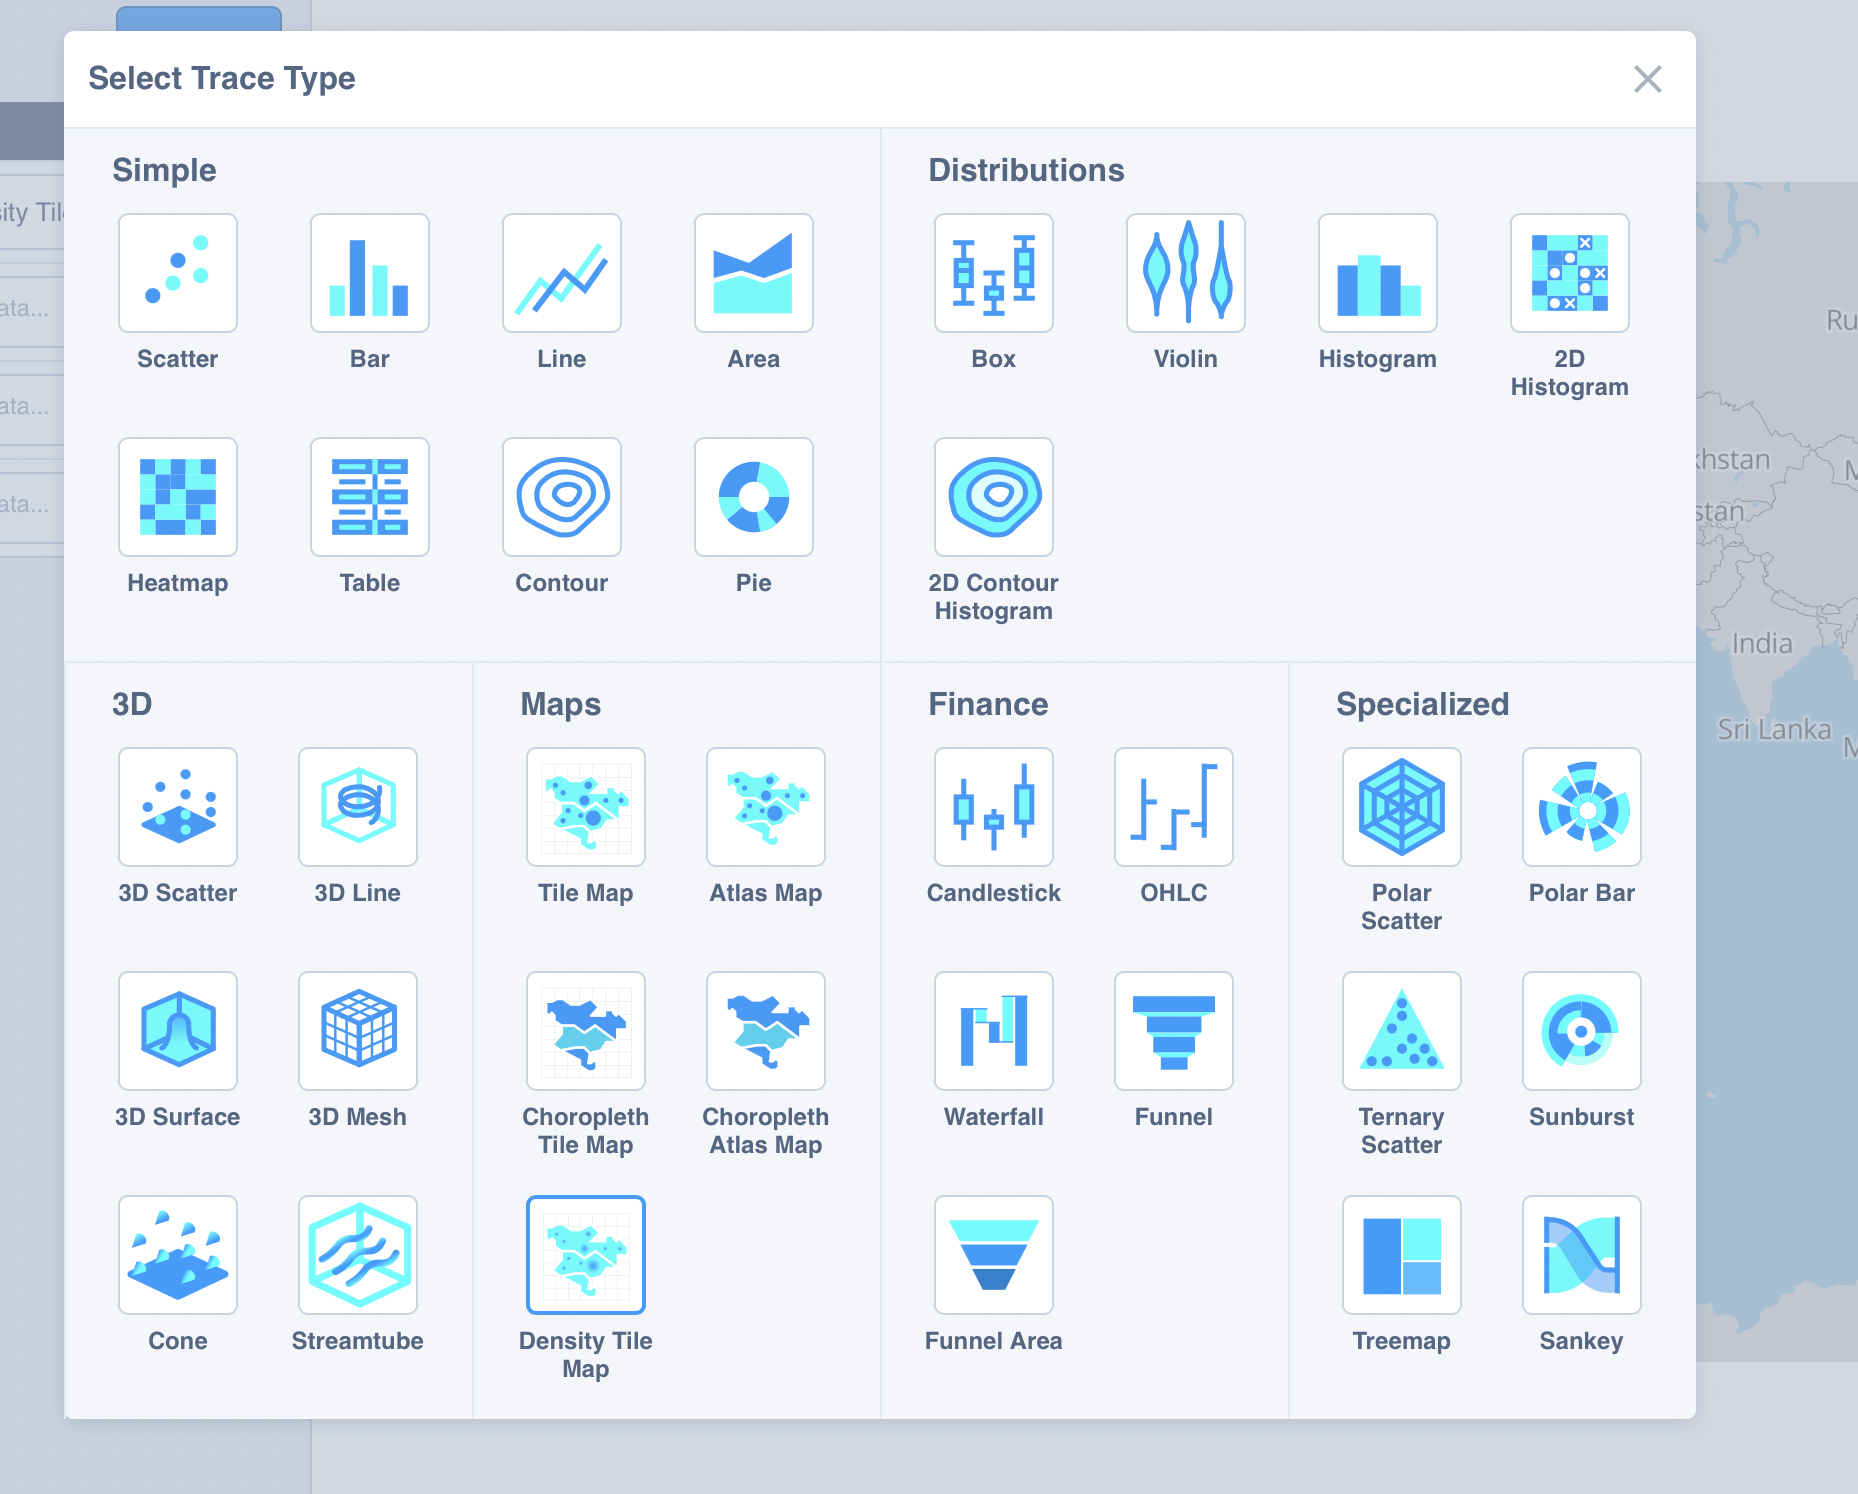 rime rates in Brooklyn, NY.
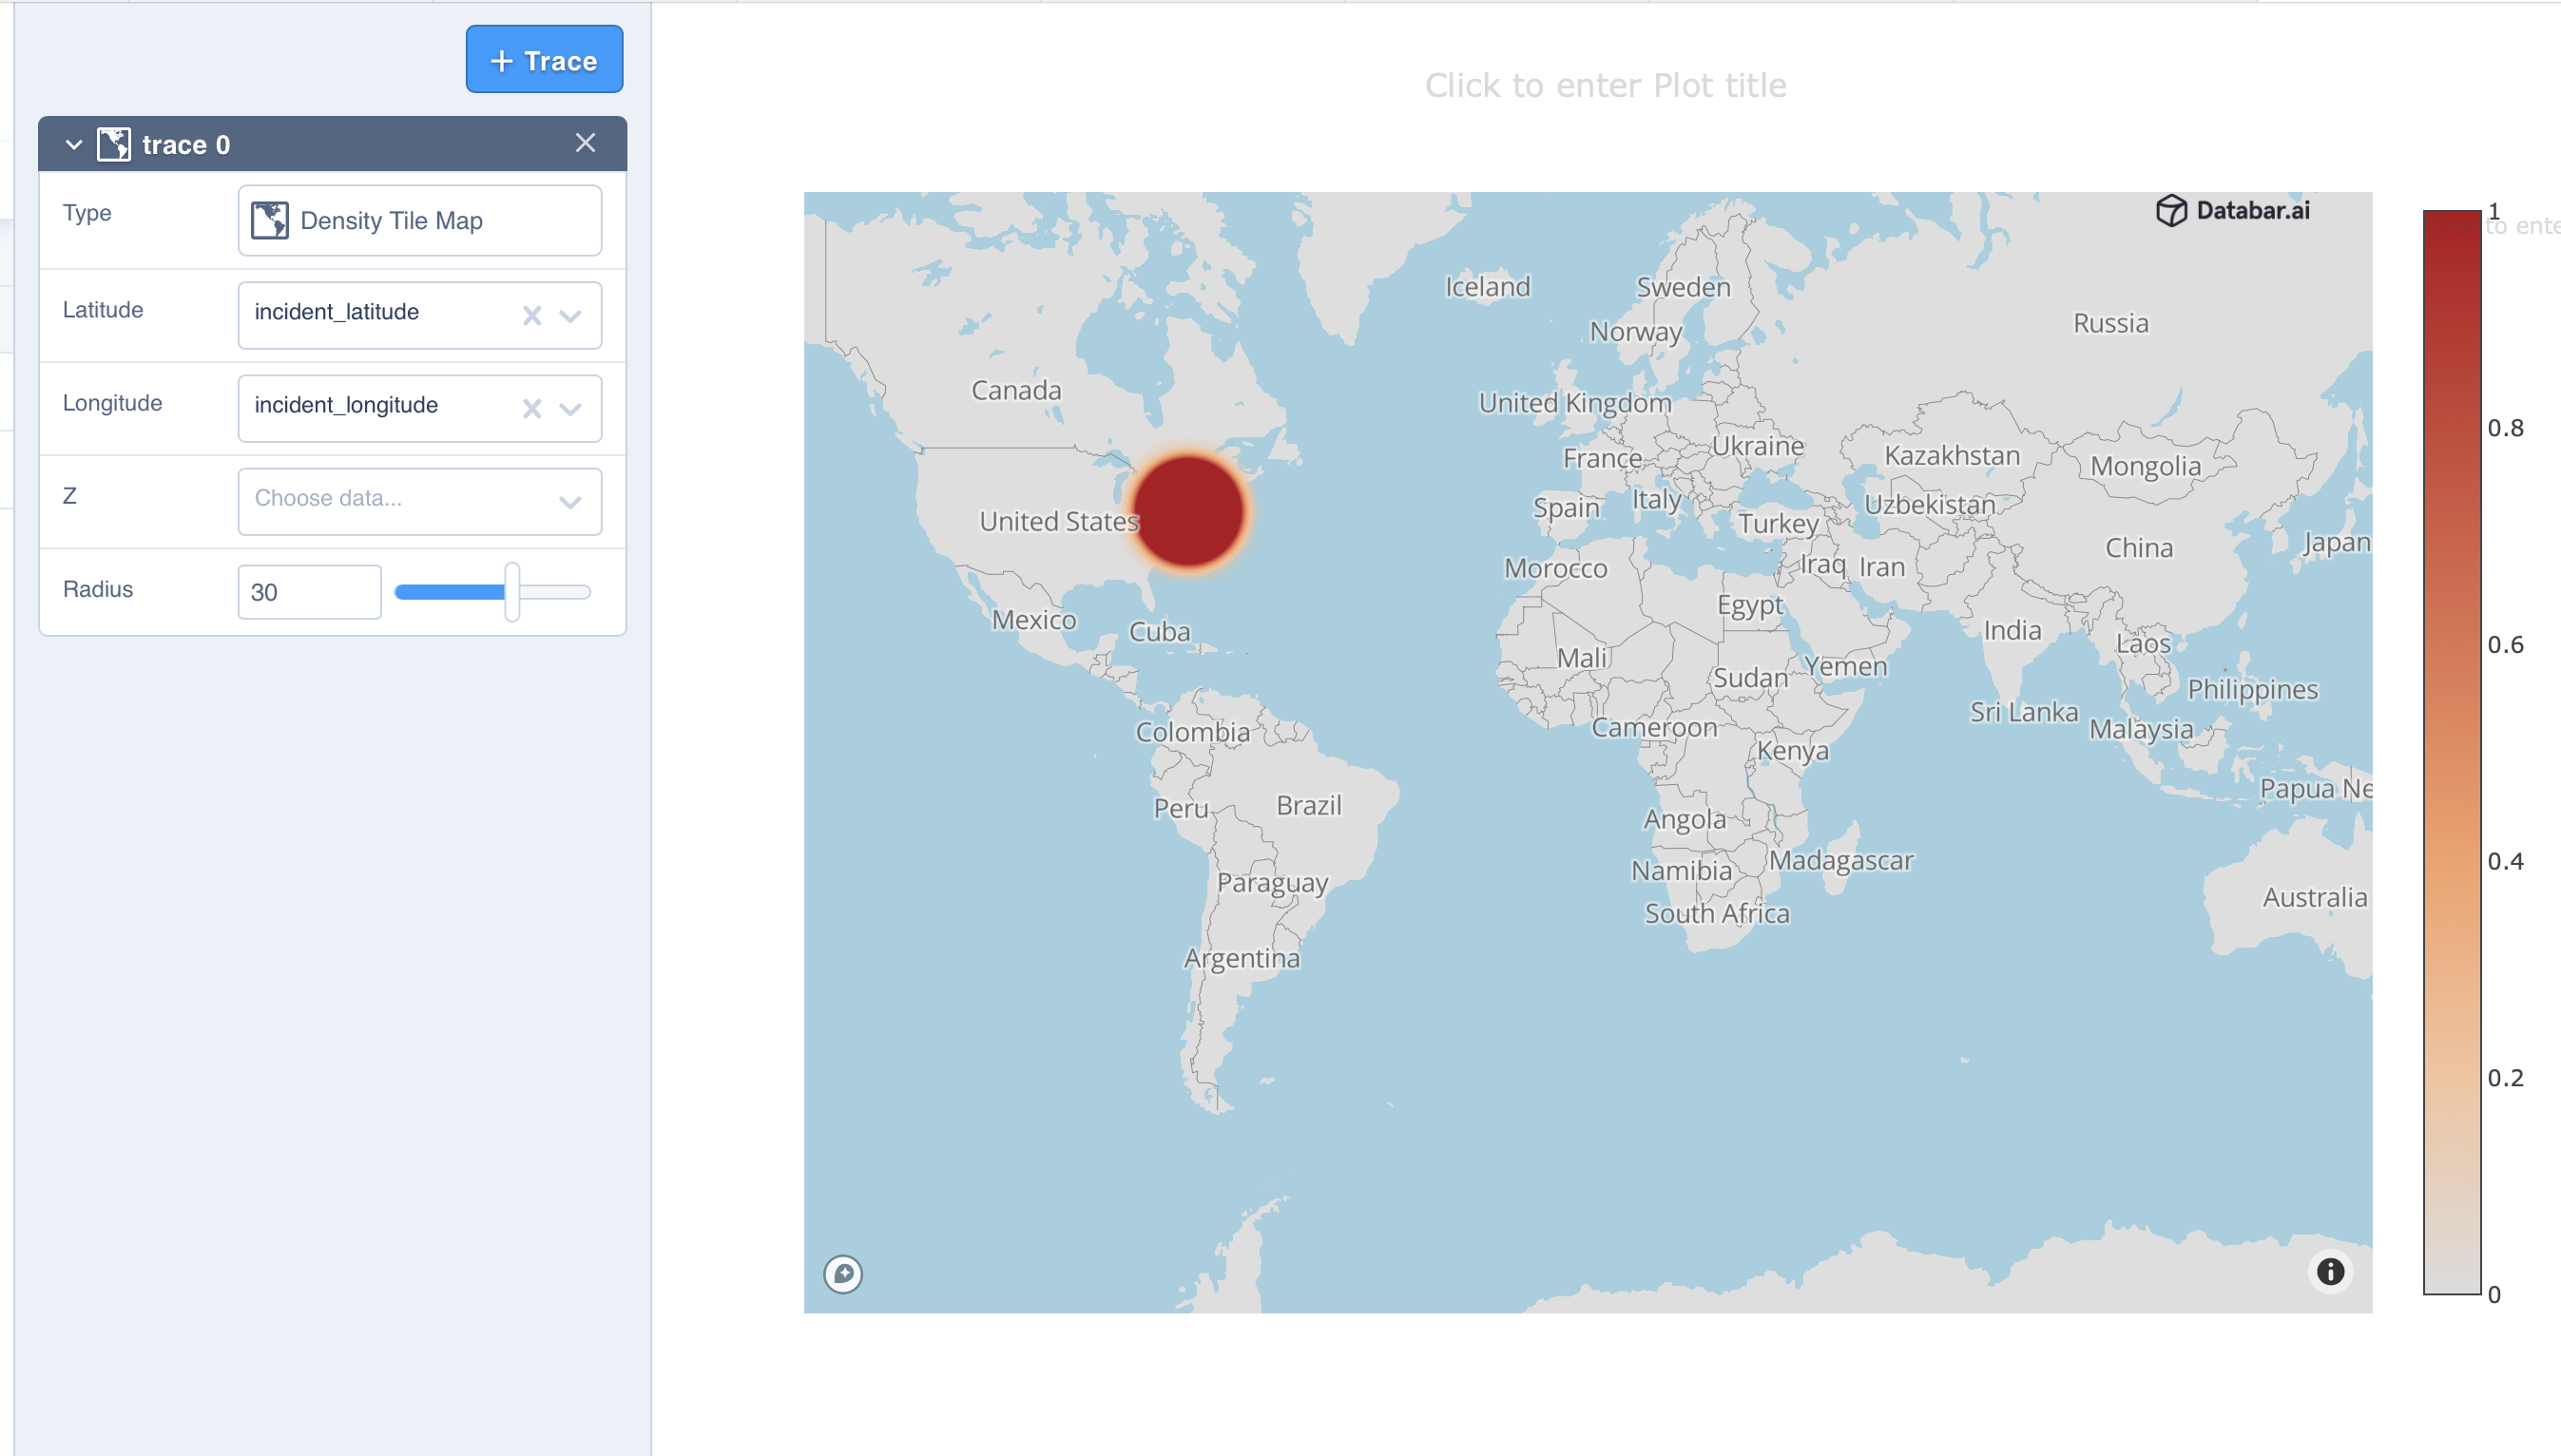
5. Now, enter your X and Y axis data with the dropdown menus. Since we are modeling crime rates in NYC, we will be inputting the Incident Longtitude and Incident Latitude as these values.
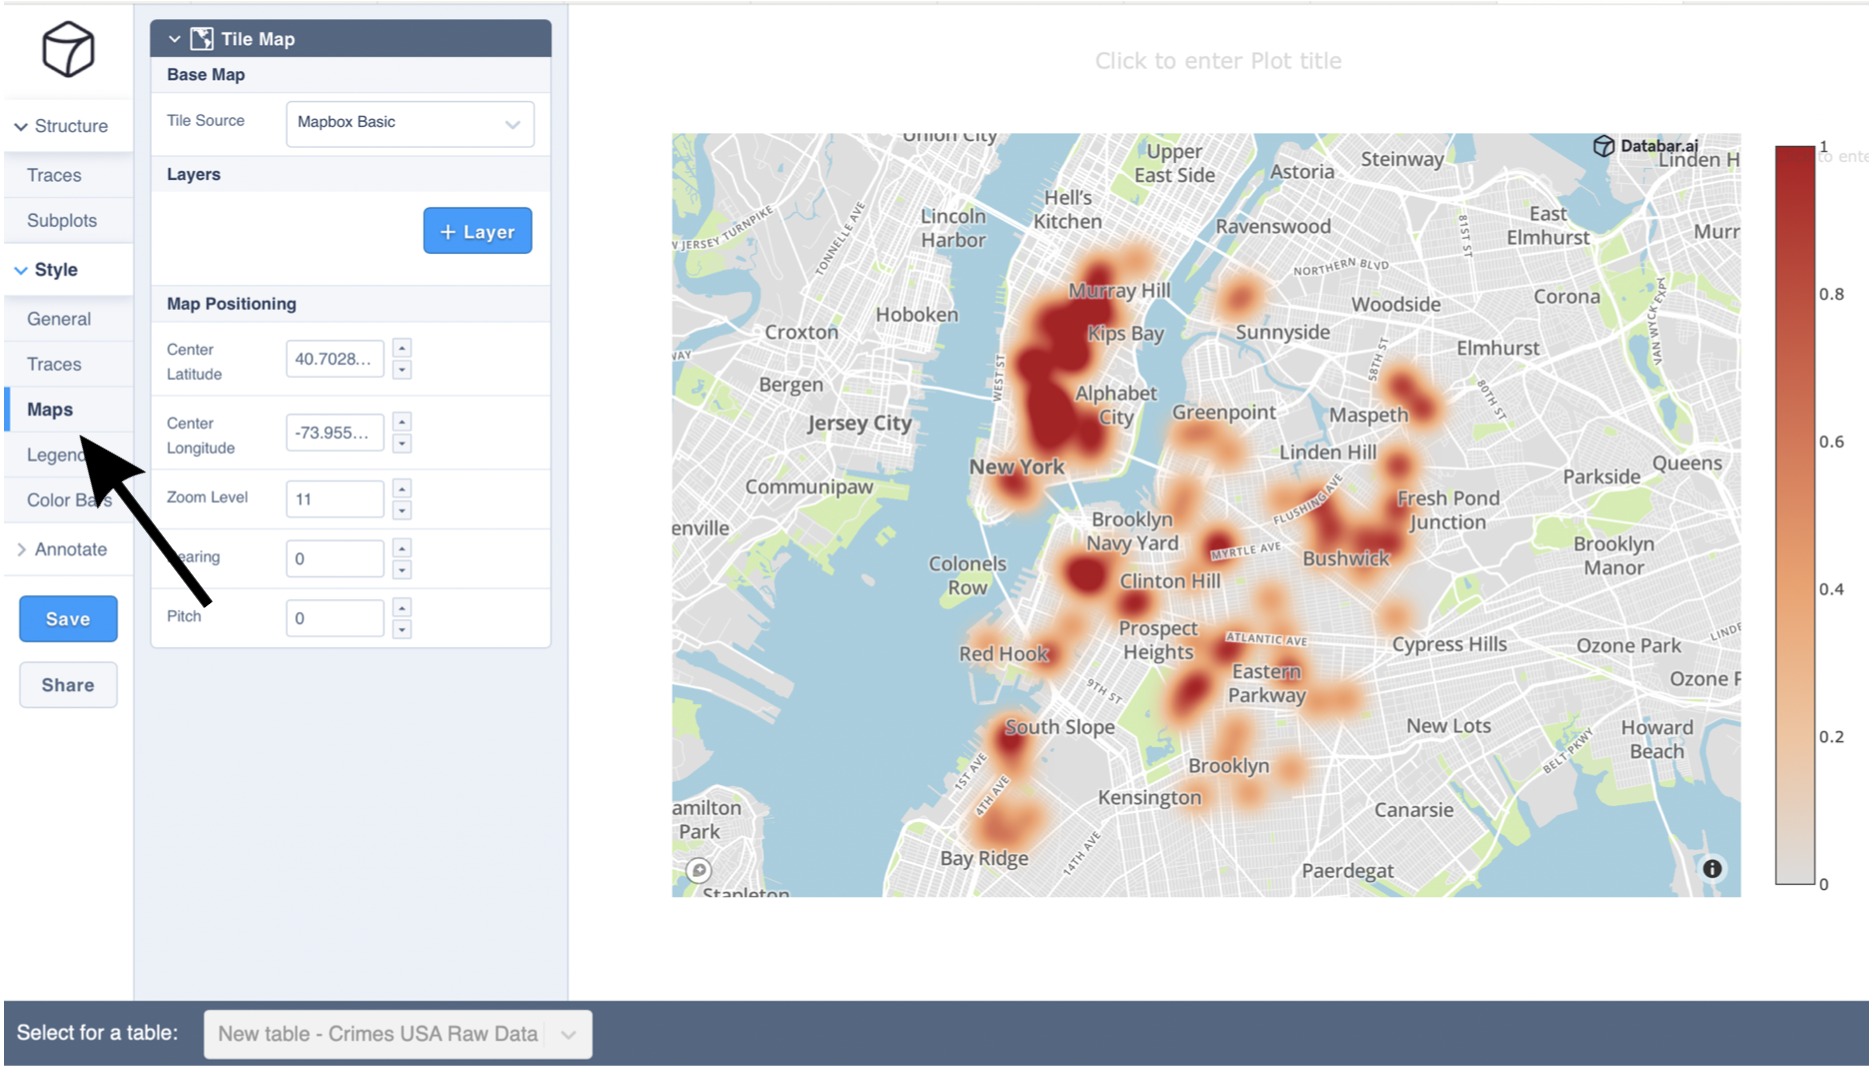
6. As we can see, the map is zoomed out. We can fix this by going to the Style dropdown on the left. Under "Map" we can adjust the zoom level.
7. Label your chart through the "Style" dropdown and add titles.
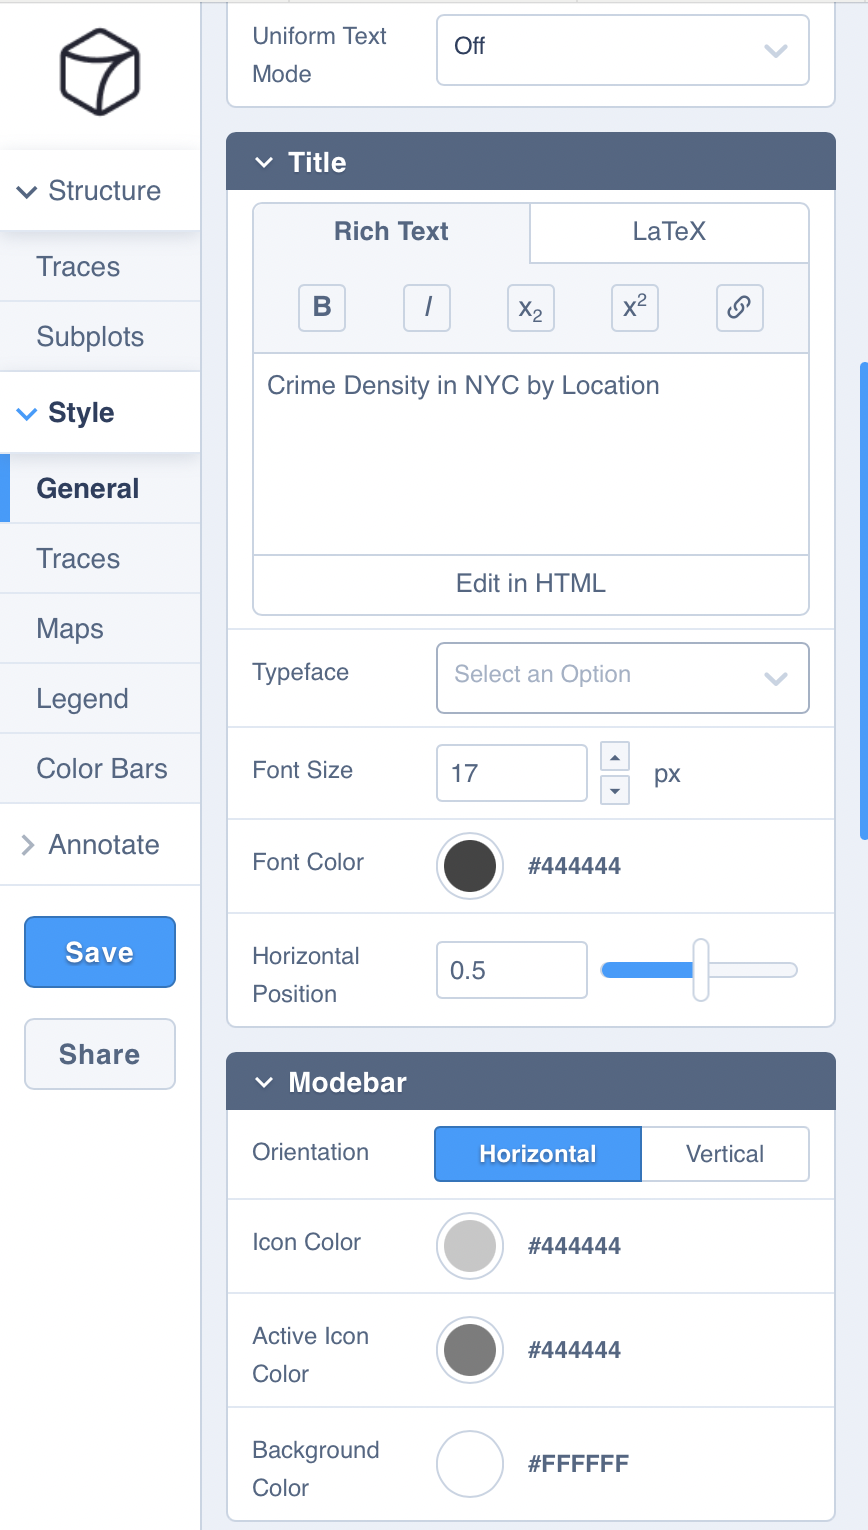
7. Congratulations! You’ve made your chart. Now, you can further customize your data models through the “Transforms” tab on the left under the “Structure” dropdown. Here, you can:
- Filter data
- Create multiple traces from one source trace
- Summarize a trace by averaging data
- Sort traces by controlling marker overlay or line connection orders
8. Further customize your chart design by changing the colors, font sizes, sizing, etc. of your chart through the “Style” dropdown.
Related articles
Data Enrichment Use Cases: 25 Ways to Leverage Better Data
Maximize revenue and efficiency with 25 actionable data enrichment applications tailored for modern B2B teams.
by Jan, June 29, 2025

Extract Text from Website: Complete Guide to Web Data Extraction in 2025
How to Automate and Scale Text Extraction from Websites for Business Success
by Jan, June 24, 2025

How to Improve Cold Email Response Rates: The Complete 2025 Guide
Proven tactics to boost your cold email replies and grow your pipeline
by Jan, June 09, 2025

Should you launch on Product Hunt during the holidays?
We analyzed historic Product Hunt launches to find out if it's a good idea to launch during the holidays. Here's what we found.
by Databar, January 04, 2023