


Companies with clearly defined Ideal Customer Profiles see significantly higher account win rates, often 50-70% better than those targeting broadly. The foundation? Firmographic data that defines who fits your ICP.
If you're treating all prospects equally, same messaging, same prioritization, same sales motion, you're leaving money on the table. Firmographic data gives you the B2B equivalent of demographics: the organizational attributes that determine whether a company is a good fit before you ever talk to them.
This guide covers what firmographic data is, the key attributes that matter, how to use it for targeting and prioritization, where the data comes from, and how to handle the accuracy challenges that trip up most teams.
What Is Firmographic Data?
Firmographic data refers to the characteristics that describe organizations, company size, industry, revenue, location, ownership structure, and growth trajectory. Just as demographics describe individual consumers (age, income, education), firmographics describe businesses.
These attributes help B2B teams answer a fundamental question: Is this company worth pursuing?
A 10-person startup has different needs, tech stacks, budgets, and buying processes than a 10,000-person enterprise. A manufacturing company faces different challenges than a SaaS business. B2B firmographic data captures these differences so sales and marketing can respond accordingly.
The practical application: instead of targeting "all companies," you target "mid-market SaaS companies with 100-500 employees, $10M-50M revenue, headquartered in North America." That specificity transforms generic outreach into relevant conversations.

Firmographic Data Examples: The Core Attributes
Different firmographic variables serve different purposes in your targeting and prioritization strategy.
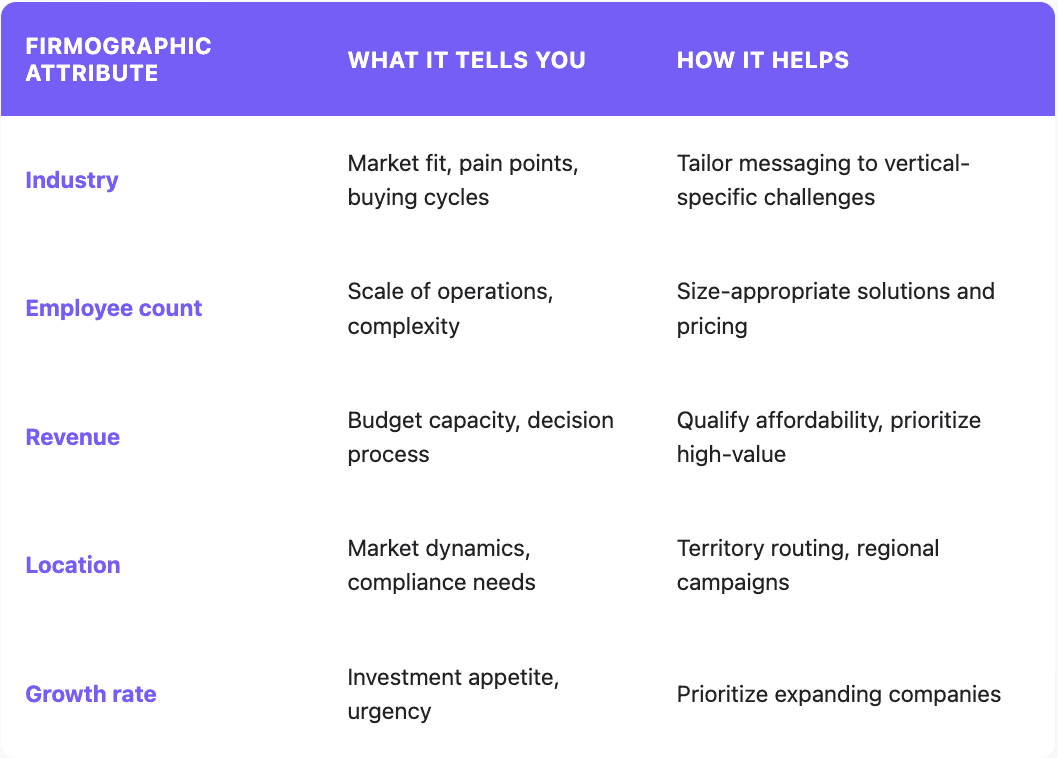
Industry and Vertical
Industry classification tells you which market a company operates in: SaaS, manufacturing, healthcare, financial services, retail, and so on. Most systems use standardized codes (NAICS or SIC) for consistency.
Why it matters: Different industries have unique challenges, buying cycles, regulatory requirements, and decision-making structures. A healthcare company navigates HIPAA compliance. A financial services firm deals with different procurement processes than a tech startup.
Firmographic data examples of industry use:
Creating vertical-specific campaigns that speak to industry pain points
Developing case studies and proof points relevant to each sector
Training sales reps on industry-specific language and objections
Company Size (Employee Count)
Employee count indicates organizational scale. Common segmentation:
SMB: 1-50 employees
Mid-market: 51-500 employees
Enterprise: 500+ employees
Why it matters: Company size correlates with buying complexity, budget authority, and sales cycle length. An SMB might have one decision-maker who can sign a contract this week. An enterprise has procurement processes, security reviews, and multiple stakeholders that extend cycles to months.
Revenue Data
Revenue data indicates purchasing power and business scale more precisely than employee count alone. A 50-person consulting firm with $50M revenue has different capacity than a 50-person startup burning through seed funding.
Why it matters: Revenue helps qualify whether a company can realistically afford your solution and whether pursuing them is worth your sales resources. It also informs pricing conversations and tier recommendations.
Geographic Location
Headquarters location, regional offices, and operational geography affect everything from territory assignment to compliance requirements.
Why it matters: Location influences market dynamics, regulatory environment, language preferences, and time zones. A company headquartered in the EU has GDPR obligations. A company with offices in multiple regions may need a different deployment strategy.
Ownership Structure
Public vs. private, VC-backed vs. bootstrapped, independent vs. subsidiary of a larger organization.
Why it matters: Ownership affects decision-making speed, budget flexibility, and growth trajectory. VC-backed companies often invest more aggressively in growth tools. Public companies have different procurement and approval processes. Subsidiaries may have decisions made at the parent level.
Growth Rate and Trajectory
Is the company growing, stable, or contracting? Hiring trends, funding rounds, and revenue growth signals indicate trajectory.
Why it matters: Growing companies have urgent needs, budget allocation for new tools, and appetite for investment. Companies in cost-cutting mode are harder to sell to regardless of fit. Growth rate is one of the strongest predictors of purchasing intent.
How to Use Firmographic Data for Account Targeting
Firmographics transform targeting from guesswork to precision.
Building Your Ideal Customer Profile (ICP)
Your ICP defines the firmographic attributes of companies most likely to buy, succeed with your product, and become valuable long-term customers.
Start with your best existing customers:
What industries are they in?
What's their typical employee count?
Revenue range?
Geographic distribution?
Common ownership characteristics?
Look for patterns. If your top 20 customers cluster around mid-market SaaS companies with 100-300 employees and $20M-$80M revenue, that's your ICP. Customer data firmographic analysis reveals these patterns systematically.
Firmographic Segmentation
Once you've defined your ICP, firmographic data enables precise segmentation:
Tiered targeting: Create segments for enterprise (custom pricing, dedicated support), mid-market (standard enterprise features), and SMB (self-serve with scaled support). Each tier gets appropriate messaging and sales motion.
Industry-specific campaigns: Develop vertical campaigns with industry-relevant case studies, terminology, and value propositions. A healthcare campaign emphasizes compliance and patient outcomes. A retail campaign emphasizes customer experience and omnichannel.
Geographic campaigns: Regional campaigns account for local market dynamics, compliance requirements, and cultural preferences.
Lead Scoring with Firmographics
Integrate firmographic attributes into your lead scoring model:
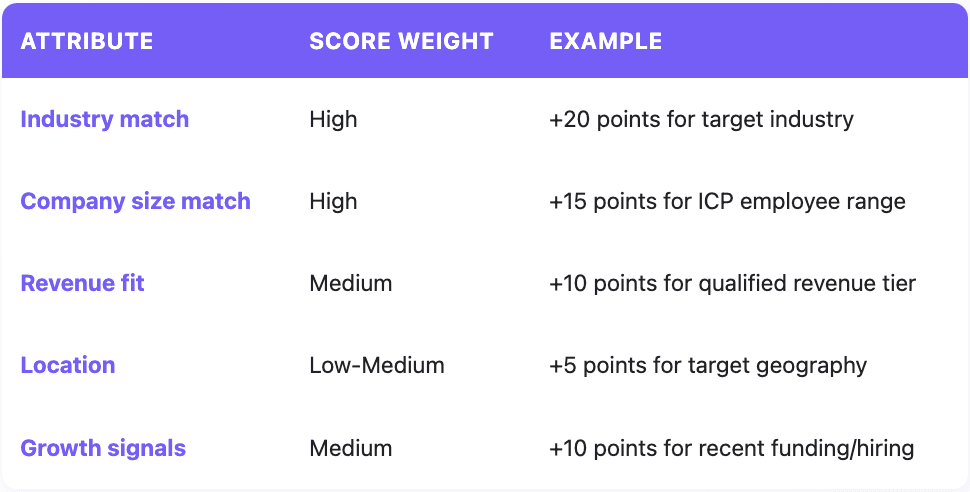
Firmographic scoring handles the "fit" dimension, whether a company matches your ICP. Combine with behavioral scoring (engagement, intent signals) for complete qualification.
Firmographic Data Sources: Where the Data Comes From
Understanding firmographic data sources helps you evaluate quality and coverage.
Third-Party Data Providers
Specialized providers like Databar and others aggregate firmographic data from multiple sources, verify it, and package it for business use.
Advantages: Scale (millions of companies), standardized formatting, regular updates, API access for automation.
Considerations: Coverage varies by provider, geography, and company size. SMB data is often less complete than enterprise. Accuracy requires verification.
Company Websites and Public Records
Annual reports, About pages, press releases, and regulatory filings provide firmographic information directly from the source.
Advantages: Current information, authoritative source.
Considerations: Manual collection doesn't scale. Not all companies publish detailed information publicly.
LinkedIn and Social Platforms
LinkedIn provides employee counts (based on profile data), industry classification, headquarters location, and company updates.
Advantages: Widely used, relatively current for employee information.
Considerations: Employee counts are estimates based on profiles, not official headcount. Revenue data isn't available. Private companies may have limited information.
CRM Enrichment
Enrichment tools automatically append firmographic data to records in your CRM as leads enter or on a scheduled basis.
Advantages: Automated, integrated with existing workflows, keeps data current.
Considerations: Quality depends on underlying data providers. Multiple sources (waterfall enrichment) improves coverage.

Firmographic Data Accuracy: Limitations and Validation
Here's the uncomfortable truth: firmographic data accuracy limitations are real, and ignoring them undermines your targeting.
The Data Decay Problem
B2B data degrades at approximately 22.5% annually, about 2.1% per month. Companies grow, shrink, get acquired, change industries, relocate. The firmographic data you collected six months ago may already be wrong for a meaningful percentage of records.
One provider's database still listed Toys "R" Us as employing 64,000 people years after the company ceased operations. That's an extreme example, but smaller inaccuracies are pervasive.
Common Accuracy Issues
Employee count estimates: Many sources derive employee counts from LinkedIn profiles or other indirect signals. These are estimates, not actual headcount. A company might show 500 employees on LinkedIn while actually employing 350.
Revenue estimates: Except for public companies filing financials, revenue data is modeled or estimated. Estimates can vary significantly between providers.
Industry classification: Companies operating across multiple sectors may be classified differently by different providers. A company building software for healthcare might appear as "Software" or "Healthcare Technology" depending on the source.
Stale data: Information that was accurate when collected may be months or years out of date by the time you use it.
Firmographic Data Accuracy Validation
Protect yourself with validation practices:
Multi-source verification. Don't rely on a single provider. Cross-reference firmographic data from multiple sources before high-stakes decisions. You can access 90+ data sources inside Databar.ai. If three sources agree, confidence increases.
Recency checks. Know when data was last verified. Prioritize providers that update frequently (monthly or quarterly) over those with annual refreshes.
Manual validation for high-value accounts. Before launching expensive ABM campaigns or enterprise pursuits, manually verify key firmographic data. Check the company's website, LinkedIn, recent news, and regulatory filings.
Ongoing monitoring. Set up alerts for firmographic changes at key accounts - funding announcements, leadership changes, acquisition news. These signals often precede data updates in provider databases.
Feedback loops. Track when firmographic data proves wrong (wrong industry, wrong size, wrong location) and feed this back to your data quality processes.
Combining Firmographics with Other Data Types
Firmographics alone tell you what a company looks like. Combining with other data types tells you what they'll do.
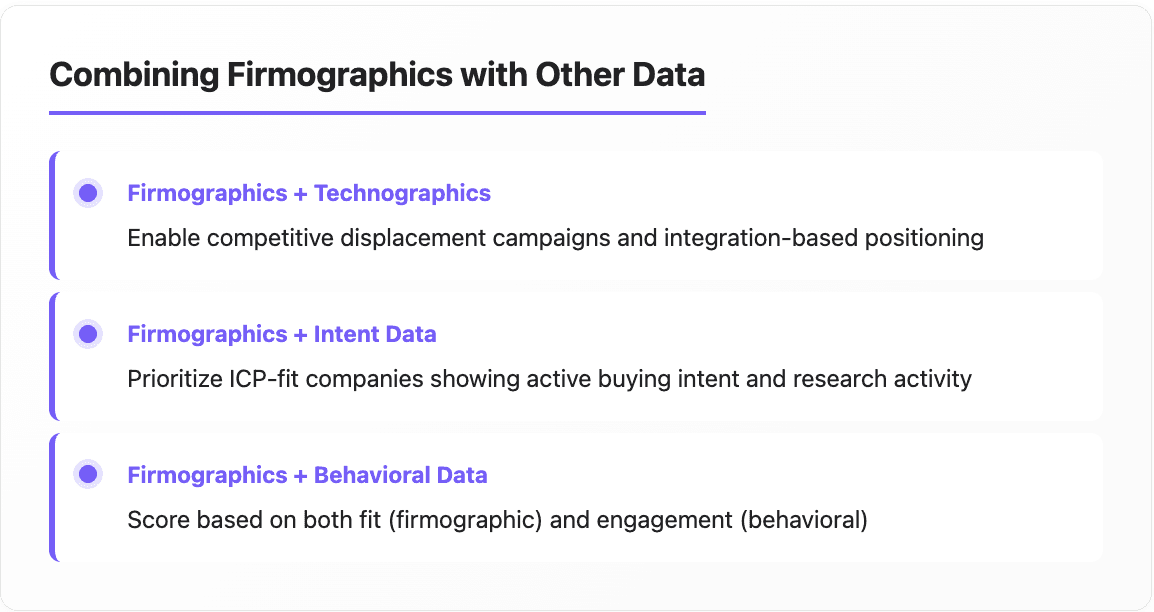
Firmographics + Technographics
Technographic data reveals the technology stack a company uses - their CRM, marketing automation, cloud infrastructure, development tools.
Combined with firmographics, technographics enable:
Competitive displacement campaigns (they use competitor X, target with switching messaging)
Integration-based positioning (they use tools you integrate with)
Technical fit qualification (they have prerequisites for your solution)
Firmographics + Intent Data
Intent data reveals when companies are actively researching topics related to your solution: content consumption, search behavior, review site activity.
Combined with firmographics:
Prioritize ICP-fit companies showing buying intent
Time outreach to research activity
Personalize based on what they're investigating
Firmographics + Behavioral Data
Behavioral data tracks how specific companies interact with your brand - website visits, content downloads, email engagement.
Combined with firmographics:
Score based on both fit (firmographic) and engagement (behavioral)
Trigger sales outreach when ICP companies reach engagement thresholds
Personalize based on content consumption patterns

Getting Started: Firmographic Data Checklist
1: Define Requirements
Analyze your best customers to identify firmographic patterns
Define your ICP with specific firmographic criteria
Prioritize which attributes matter most for your business
2: Evaluate Sources
Assess your current firmographic data quality and coverage
Compare 2-3 firmographic data providers for your target market
Test coverage and accuracy with a sample of known accounts
3: Implement
Configure enrichment to append firmographics to new leads
Run batch enrichment on existing database
Update lead scoring to incorporate firmographic attributes
4: Activate
Build firmographic-based segments for campaigns
Train sales on using firmographic data for prioritization
Establish validation processes for high-value accounts
How to Get Started
Firmographic data is foundational infrastructure for B2B targeting. Without it, you're guessing which companies to pursue. With it, you're making informed decisions about where to invest sales and marketing resources.
But firmographics are just the starting point. The companies getting 73% larger deal sizes aren't just collecting better firmographic data, they're combining it with technographic signals, intent data, and behavioral patterns to identify accounts that are both a good fit and actively in-market.
Start with clean, accurate firmographic data as your foundation. Build your ICP on real patterns from your best customers. Then layer in additional signals to move from "who fits" to "who's ready to buy."
FAQ
What is firmographic data? Firmographic data refers to the characteristics that describe organizations - attributes like industry, company size (employee count), revenue, headquarters location, ownership structure, and growth trajectory. It's the B2B equivalent of demographic data, helping sales and marketing teams segment and target businesses based on organizational attributes.
What are firmographic data examples? Common firmographic attributes include: industry vertical (SaaS, manufacturing, healthcare), employee count (50, 500, 5,000), annual revenue ($10M, $100M, $1B), headquarters location (San Francisco, London, Singapore), ownership type (public, private, VC-backed), and growth indicators (recent funding, hiring trends, revenue growth rate).
What are the limitations of firmographic data accuracy? Key limitations include data decay (22.5% annual degradation), estimated values (employee counts from LinkedIn, modeled revenue), inconsistent classification (companies categorized differently by different providers), and stale information. Validation through multiple sources and manual verification for high-value accounts helps mitigate these issues.
How do you validate firmographic data accuracy? Validation approaches include cross-referencing multiple data sources, checking data recency, manual verification for high-value accounts, ongoing monitoring for changes at key accounts, and establishing feedback loops when data proves inaccurate. Never rely on a single provider for critical targeting decisions.
What's the difference between firmographic and demographic data? Firmographic data describes organizations (company size, industry, revenue). Demographic data describes individuals (age, gender, income). Firmographics are used for B2B targeting and segmentation. Demographics are used for B2C targeting. In B2B contexts, you often need both, firmographics to qualify the company, demographics to understand the individual decision-makers.
Recent articles
See all


