

Your marketing team reports lead volume is up 30%. Sales says pipeline is strong. Customer success shows retention holding steady. Then the board meeting happens and revenue missed forecast by 15%.
Nobody lied. Each team measured their piece accurately. The problem is that nobody measured how the pieces connect. Marketing generated leads that sales could not convert because they lacked context. Sales closed deals that churned in 90 days because CS had no visibility into what was promised. CS identified expansion opportunities that never reached a rep.
This is the core problem revenue intelligence solves. Not better dashboards. Not more data. A structural foundation that connects every revenue-generating activity across your GTM org into one system that tells you what is happening now, what will happen next, and where to act.
We call that foundation the data skeleton. It is the framework that holds your revenue data together the same way a skeleton holds a body together. Without it, you have a pile of disconnected metrics. With it, everything moves in coordination.

Why Departmental Reporting Breaks Down
B2B buying does not follow departmental lines. A prospect downloads a whitepaper (marketing's domain), starts a product trial (product's domain), books a demo with sales, goes quiet for three weeks, then accelerates after a conversation with customer support about implementation.
Try measuring that journey with separate dashboards. You cannot. Marketing sees an MQL. Sales sees a demo that went cold. Support sees a random inbound question. Nobody sees the full picture: a buyer who was evaluating the product on their own terms and only needed one implementation question answered before moving forward.
Revenue intelligence treats the entire buyer journey as one connected system instead of separate departmental funnels. The shift matters because the connections between teams are where deals are won or lost.
Handoff delays between marketing and sales reduce conversion rates. Context lost during the sales-to-CS transition causes churn. Expansion signals identified by CS that never reach sales leave revenue on the table. These gaps are invisible in departmental reporting. They only show up when you measure the system as a whole.
What Revenue Intelligence Actually Is (and Is Not)
Revenue intelligence is not conversation recording. It is not predictive analytics bolted onto your CRM. It is not a dashboard that pulls data from five tools into one screen.
Revenue intelligence is the systematic capture, integration, and analysis of all revenue-generating activities to create insights that drive coordinated action across your GTM team.
If your CRM is a photo album of deals, revenue intelligence is the movie showing how those deals develop and where they connect across teams.
Four components make it work:
Unified data capture. Automatic collection of activities, interactions, and outcomes from marketing automation, sales tools, CS platforms, and finance systems. No manual entry. No missed touchpoints.
Cross-functional analysis. Metrics that span departments. Marketing-qualified leads to sales-qualified opportunities. Initial deal size to expansion revenue. Customer health scores to renewal predictions. These connections only exist when the data is unified.
Predictive modeling. AI-powered forecasts that use the complete customer journey, not just pipeline stages. Deal outcome prediction. Expansion opportunity identification. Churn risk assessment. All based on signals from every team, not just sales.
Coordinated action triggers. Automated workflows that notify the right team when conditions change. At-risk accounts that need a CS call. High-intent leads that need an immediate sales response. Expansion-ready accounts that need a commercial conversation.
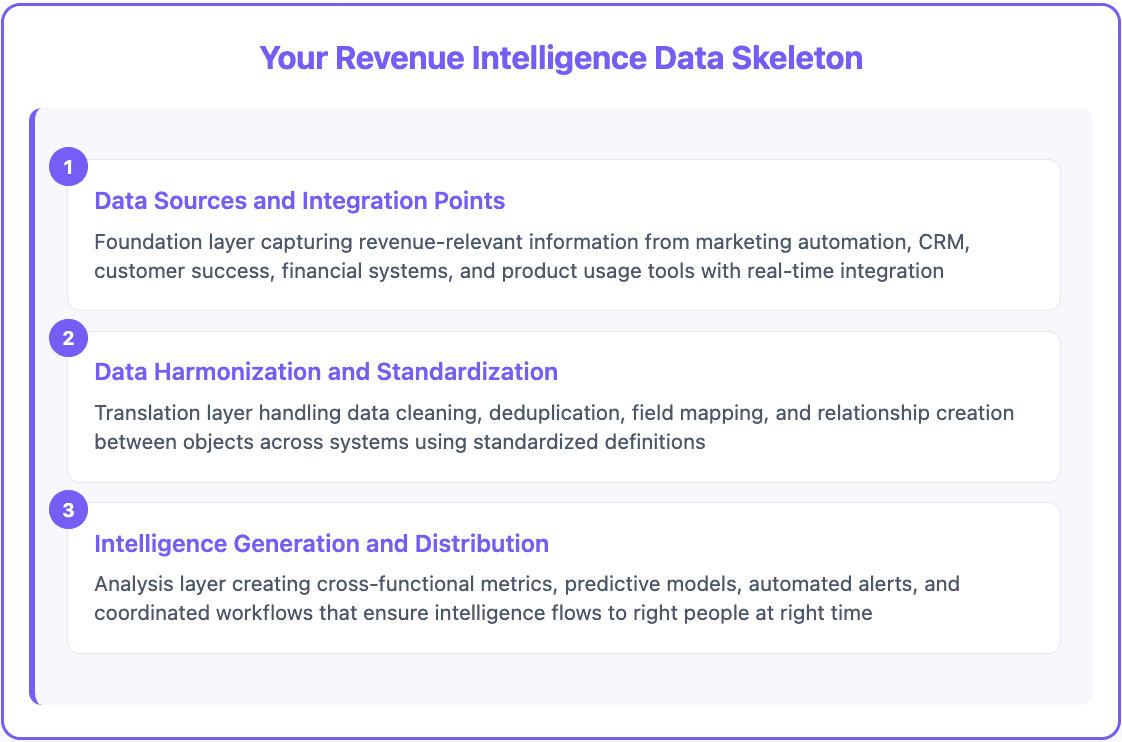
The Three Layers of Your Data Skeleton
Most companies approach revenue intelligence backwards. They pick a tool, connect a few data sources, build a dashboard, and call it done. Six months later, nobody uses it because the underlying data is messy, incomplete, and inconsistent.
The teams that get this right start with the skeleton first. Three layers, built in order.
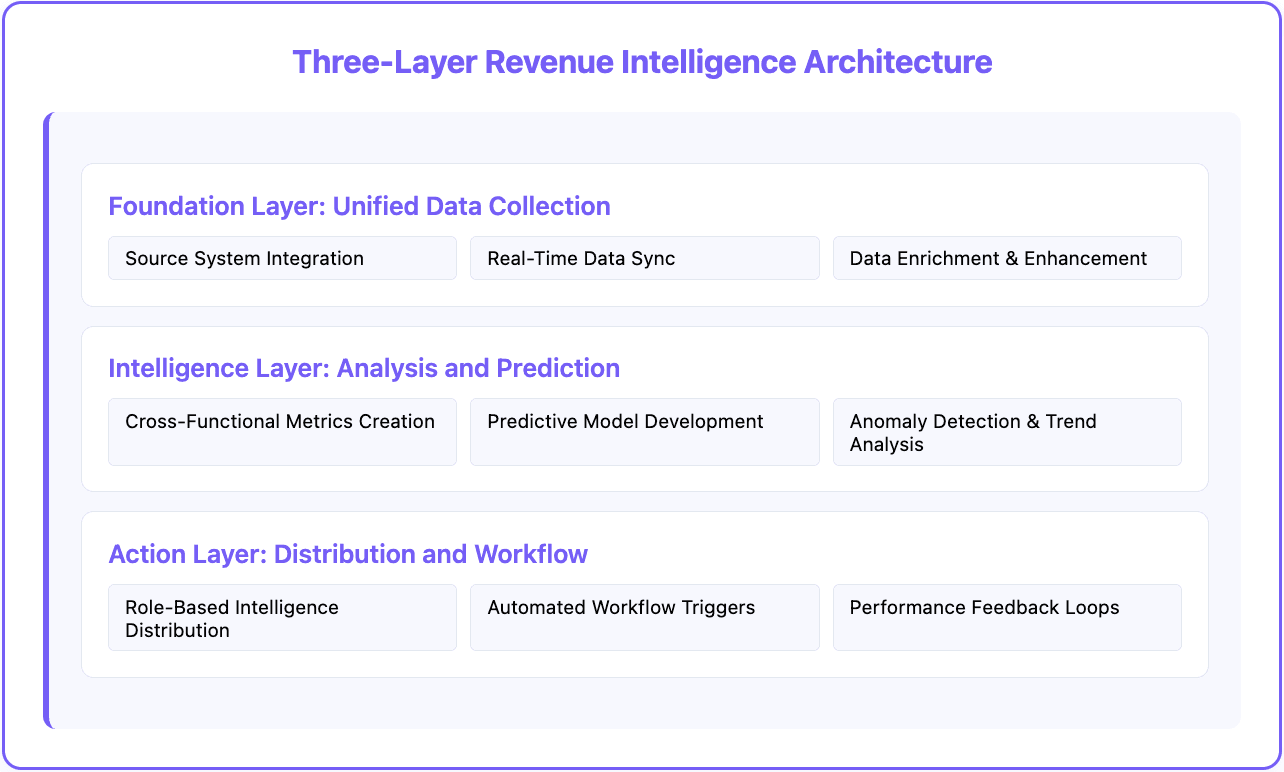
Layer 1: Data Sources and Integration
This is the foundation. Every system that captures revenue-relevant information needs to feed into the skeleton. That typically means 8 to 15 tools across your stack:
Marketing automation (HubSpot, Marketo, Pardot)
CRM (Salesforce, HubSpot, Pipedrive)
Sales engagement (Outreach, SalesLoft, Apollo)
Customer success (Gainsight, ChurnZero, Totango)
Finance (QuickBooks, NetSuite, Stripe)
Product and support (Zendesk, Mixpanel, Amplitude)
The critical requirement: real-time API integration, not weekly CSV uploads. If your data is 24 hours stale, your intelligence layer is making decisions on yesterday's reality.
Layer 2: Harmonization and Standardization
Raw data from different systems rarely matches. Marketing calls them "MQLs." Sales calls them "SQLs." CS calls them "Active Accounts." Finance calls them "Recognized Revenue." Four names for overlapping groups of the same companies.
Layer 2 translates between systems using standardized definitions. A contact record in your marketing automation platform connects to the same contact in your CRM, CS platform, and financial system. This layer handles deduplication, field mapping, data cleaning, and relationship creation across objects.
This is also where data enrichment fills gaps. Raw CRM data often lacks the context needed for intelligent analysis. Company firmographics, technographic data, funding signals, and intent data turn thin records into complete profiles. CRM enrichment tools automate this step so your data skeleton starts with complete, accurate information rather than partial records.
Databar fits here as the enrichment layer. The platform connects to 100+ data providers and fills gaps in contact and company data automatically. Instead of researching accounts manually or running separate enrichment tools, you build the enrichment step into your data skeleton and every record gets the context it needs.
Layer 3: Intelligence and Action
This is where raw data becomes decisions. Cross-functional metrics show performance across departments. Predictive models forecast outcomes based on the complete customer journey. Automated alerts notify teams when action is needed. Coordinated workflows prevent opportunities from falling between departmental cracks.
The skeleton framework makes sure intelligence reaches the right people at the right time with enough context to act immediately.
The Metrics That Actually Matter
Traditional reporting measures department performance. Revenue intelligence measures revenue system performance. The distinction determines whether you can predict your trajectory or just react to what already happened.
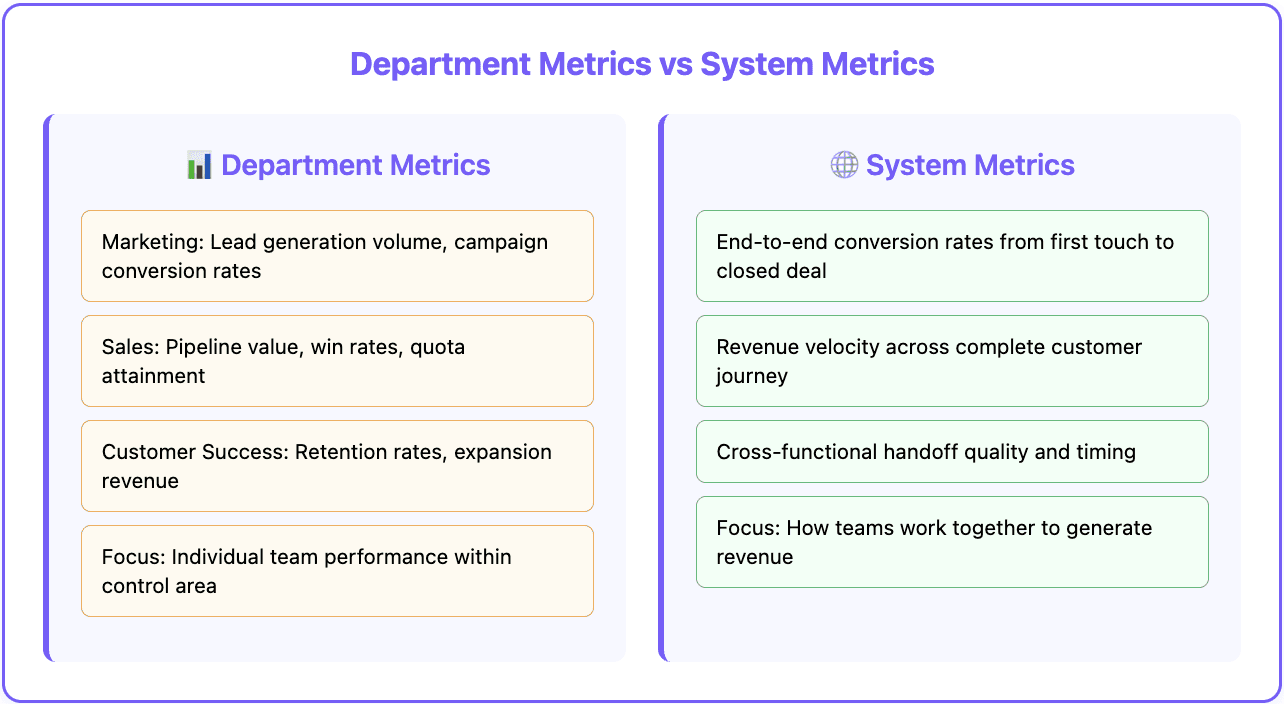
Department metrics focus on individual team performance:
Marketing: Lead volume, campaign conversion rates, cost per lead
Sales: Pipeline value, win rates, quota attainment
CS: Retention rates, expansion revenue, health scores
System metrics focus on how teams work together to generate revenue:
End-to-end conversion from first touch to closed deal
Revenue velocity across the complete buyer journey
Cross-functional handoff quality and timing
Customer lifetime value including acquisition, expansion, and retention
Five cross-functional metrics belong in every revenue intelligence system.
Lead-to-revenue velocity. Time from first marketing touch to closed deal, broken down by source, qualification path, and deal type. This shows how effectively your entire system converts interest into revenue.
Pipeline quality index. Deal progression predictability based on engagement across marketing, sales, and product touchpoints. Not just pipeline volume. Pipeline that actually converts.
Revenue system efficiency. Revenue generated per dollar invested across all GTM departments, including marketing spend, sales costs, and CS investment.
Handoff success rate. Quality metrics for critical transitions. Marketing to sales qualification. Sales to CS implementation. CS to sales expansion. Every handoff is a potential leak.
Unified customer health. Combined scoring that incorporates product usage, support interactions, sales engagement, and payment behavior to predict renewal probability and expansion potential.
Why Most Revenue Intelligence Projects Fail
Three patterns show up repeatedly.
Tool-First Thinking
Companies pick a revenue intelligence platform based on features and demos without assessing their data foundation. The platform assumes clean, standardized data across integrated systems. But the CRM is missing contact data, marketing automation has duplicate leads, and CS is not connected to anything.
No intelligence tool fixes bad data. Start with a data foundation audit before you evaluate platforms.
Departmental Resistance
Revenue intelligence requires teams to share data and coordinate metrics. Sales does not want marketing seeing pipeline data. Marketing does not want to be measured on sales conversion. CS does not want churn numbers scrutinized by other teams.
This only works with executive mandate and shared incentives. If departments are still measured and rewarded on departmental metrics alone, unified intelligence will not get adopted regardless of how good the platform is.
Implementation Without Adoption
Teams build dashboards that nobody uses because they do not connect to daily workflows. Sales needs deal-specific insights during pipeline reviews, not a monthly executive dashboard. Marketing needs campaign feedback during planning cycles. CS needs risk alerts during account reviews.
Design intelligence distribution around how teams actually work, not how executives want to see reports.
How to Build Your Data Skeleton in Four Phases
The implementation follows a foundation-first approach. Skip phases and you end up rebuilding later.
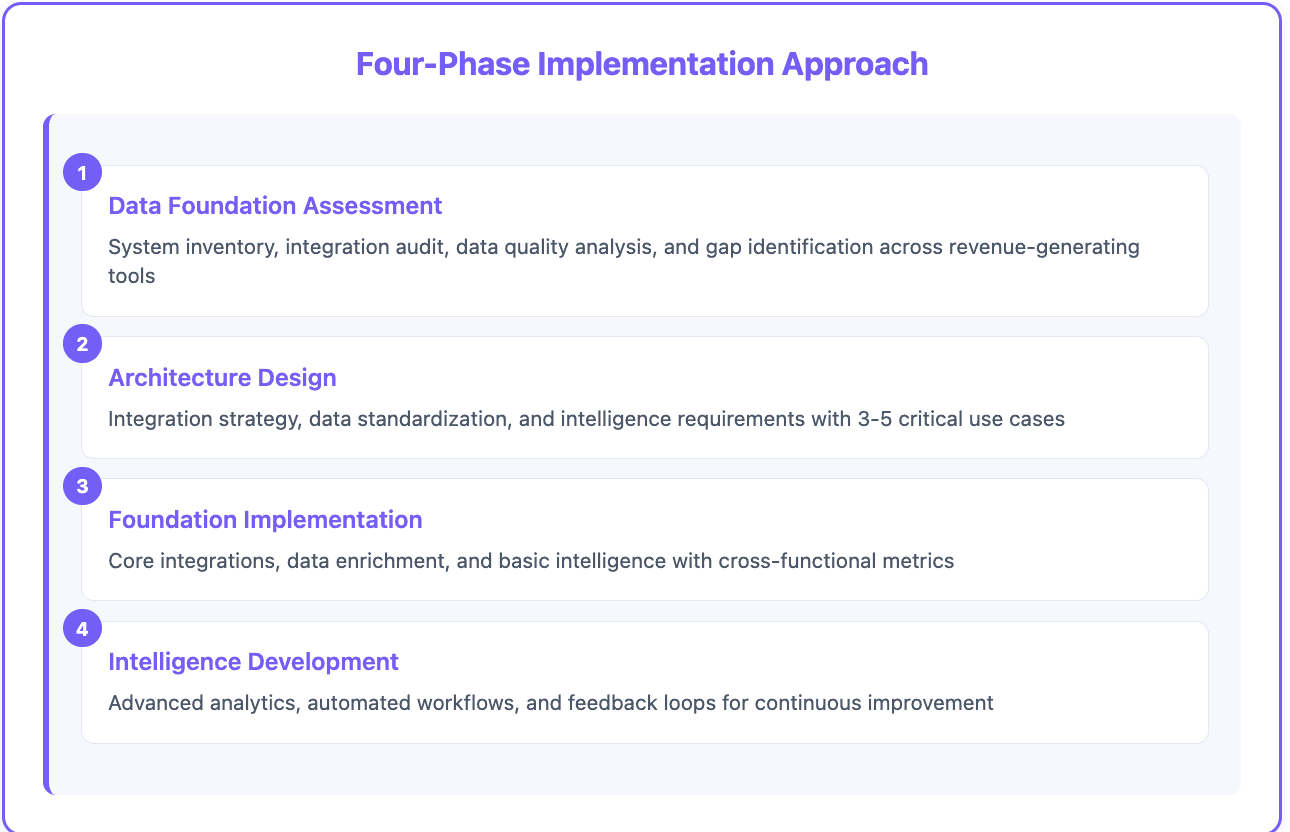
Phase 1: Foundation Assessment
System inventory. Catalog every tool that captures revenue-relevant data. Map what data each system holds and how it currently connects (or does not connect) to other systems.
Data quality analysis. Assess completeness, accuracy, and consistency across systems. Look for duplicates, missing fields, inconsistent definitions, and broken integrations.
Gap identification. Determine what enrichment is needed. This often includes company firmographics, verified contact data, technographic data, and intent signals.
Phase 2: Architecture Design
Integration strategy. Plan how systems connect, what data flows between them, and how conflicts get resolved. Prioritize API-based real-time integration over batch transfers.
Data standardization. Create unified definitions for critical objects and fields. One contact record connects to the same person across every system. One company definition works for marketing, sales, and CS.
Intelligence requirements. Define the 3 to 5 most critical insights you need and what actions those insights should trigger. Start narrow. Expand after the foundation proves out.
Phase 3: Foundation Implementation
Core integrations. Connect your primary systems (CRM, marketing automation, CS platform) with real-time synchronization.
Data enrichment. Implement automated enrichment to fill gaps in contact and company records. This is where Databar adds immediate value. The platform enriches your database with data from 100+ providers automatically, so every record in your skeleton has the context needed for intelligent analysis. No manual research. No separate enrichment contracts.
Basic metrics. Start with fundamental cross-functional measurements: lead-to-revenue conversion, pipeline velocity, and customer expansion tracking. Prove value before adding complexity.
Phase 4: Intelligence Development
Predictive models. Build forecasting for deal outcomes, expansion opportunities, and churn risk using your complete customer journey data.
Automated workflows. Create triggers that coordinate team actions. At-risk accounts prompt CS outreach. High-intent leads trigger immediate sales response. Expansion signals route to the right rep.
Feedback loops. Measure whether intelligence-driven decisions improve outcomes. Use that feedback to refine models and workflows. The system gets smarter over time, but only if you close the loop.

Start With Your Data, Not Your Dashboard
Revenue intelligence is not a platform you buy. It is a foundation you build. The companies that get it right do not start with the dashboard. They start with the data skeleton: clean, connected, enriched data that spans their entire GTM operation.
If your CRM has gaps, your marketing data lives in a separate silo, and your CS platform is disconnected from sales, fix that first. The intelligence layer cannot produce useful output from broken input.
Databar helps with the enrichment piece. 100+ data providers through one platform, filling the gaps in your contact and company data so your skeleton starts with complete, accurate records. See how B2B data enrichment tools fit into the GTM data stack.
Try Databar free and enrich your first 100 records. Start building your data skeleton with complete, accurate data from day one.
Frequently Asked Questions
What is the difference between revenue intelligence and CRM reporting?
CRM reporting shows what happened within your sales process. Revenue intelligence integrates data across marketing, sales, and customer success to show the complete customer journey and predict future outcomes. CRM reports are department-specific. Revenue intelligence provides cross-functional insights that drive coordinated action across teams.
Do I need to replace my CRM to implement revenue intelligence?
No. Revenue intelligence platforms integrate with your existing CRM, marketing automation, and CS tools. The goal is to connect and enhance your current systems, not replace them. Most implementations work with Salesforce, HubSpot, Pipedrive, and other popular platforms.
What data quality do I need before starting?
You need consistent contact and company records across systems, standardized field definitions, and regular data cleaning processes. Aim for 80%+ data completeness in your CRM and marketing automation before implementing intelligence layers. Data enrichment tools fill remaining gaps, but basic hygiene needs to be in place first.
What is the most common reason revenue intelligence projects fail?
Tool-first thinking. Companies select platforms based on features without assessing their data foundation. If your CRM has missing data, marketing has duplicates, and CS is disconnected, no intelligence platform will fix those underlying problems. Start with the data skeleton, then add the intelligence layer.
How long does it take to build a revenue intelligence foundation?
Phase 1 (assessment) takes 2 to 4 weeks. Phase 2 (architecture) takes 2 to 3 weeks. Phase 3 (implementation) takes 4 to 8 weeks depending on the number of systems being integrated. Phase 4 (intelligence) is ongoing. Most teams see initial value within 90 days of starting Phase 3.
How does data enrichment fit into revenue intelligence?
Enrichment fills the gaps in your data skeleton. Raw CRM data often lacks company firmographics, verified contact details, tech stack information, and buying signals. Enrichment platforms like Databar pull this data from 100+ providers automatically, giving your intelligence layer complete records to analyze instead of partial profiles.
Also Interesting
Recent articles
See all


